the Creative Commons Attribution 4.0 License.
the Creative Commons Attribution 4.0 License.
Precipitation transition regions over the southern Canadian Cordillera during January–April 2010 and under a pseudo-global-warming assumption
Juris D. Almonte
Ronald E. Stewart
The occurrence of various types of winter precipitation is an important issue over the southern Canadian Cordillera. This issue is examined from January to April of 2010 by exploiting the high-resolution Weather Research and Forecasting (WRF) model Version 3.4.1 dataset that was used to simulate both a historical reanalysis-driven (control – CTRL) and a pseudo-global-warming (PGW) experiment (Liu et al., 2016). Transition regions, consisting of both liquid and solid precipitation or liquid precipitation below 0 ∘C, occurred on 93 % and 94 % of the days in the present and PGW future, respectively. This led to accumulated precipitation within the transition region increasing by 27 % and was associated with a rise in its average elevation by 374 m over the Coast Mountains and Insular Mountains and by 240 m over the Rocky Mountains and consequently to an eastward shift towards the higher terrain of the Rocky Mountains. Transition regions comprised of only rain and snow were most common under both the CTRL and PGW simulations, although all seven transition region categories occurred. Transition region changes would enhance some of the factors leading to avalanches and would also impact ski resort operations.
- Article
(7309 KB) - Full-text XML
- BibTeX
- EndNote
The phase of precipitation at the surface is paramount to many processes within the water cycle, and it also affects the way we manage water and at times its risk to society. During the cold season, precipitation can be solid (snow), liquid (rain and freezing rain) or mixed (wet snow for example). The precipitation type transition region, where mixed or freezing precipitation occurs, lies between areas of all rain and all snow if they both occur. Midlatitudes regions, particularly over many mountains, have frequent transition region occurrences during the cold season, as the 0 ∘C isotherm can be situated anywhere along the mountainside.
The transition region has significant impacts on the transportation, tourism and water management sectors. For example, transition precipitation, such as freezing rain, can bring transportation to a halt on major highways, such as the event on the Coquihalla Highway in British Columbia in 2017 (Canadian Press, 2017). Moreover, avalanches occurring over southwestern Canada can disrupt traffic or cause injury or death to those in their paths. At least some of these avalanches can be attributed to transition precipitation and its sequential ordering (Hägeli and McClung, 2003; McClung and Schaerer, 2006; Abe, 2004; Jamieson and Langevin, 2004; Jamieson et al., 2009; COMET, 2010). The ski industry is an important economic sector in many mountain towns, drawing both national and international tourists. These well-established ski resorts depend on the consistent seasonal occurrence of solid precipitation. Transition regions that occur within ski resorts demarcate poor skiing conditions, and, to counteract this, additional maintenance is required to groom and maintain adequate skiing conditions, which may include the use of snow-making equipment. From a hydrological perspective, the transition region demarcates the lower temperature threshold of precipitation only falling as rain; this rain can lead to runoff and eventual flooding (Lundquist et al., 2008).
Transition precipitation across Canada has been studied for some time (Stewart and King, 1987; Stewart and Mcfarquhar, 1987; Stewart, 1992; Stewart et al., 1995, 2015; Cortinas et al., 2004; Thériault et al., 2012, 2014, 2018; Groisman et al., 2016). Many of these studies focussed on individual events, but, in terms of climatology, Cortinas et al. (2004) carried out an analysis of hazardous winter precipitation types (ice pellets, freezing rain and freezing drizzle) that can be found within the transition region. They found preferential regions of freezing rain and ice pellets over the Rocky Mountains using available manual observational data. However, due to the paucity of human observers located over the Canadian Cordillera and the available information being overwhelmingly within valleys, these findings may not be representative of what is occurring at higher elevations. A recent study by Groisman et al. (2016) investigated changes in climatological occurrences of freezing precipitation. They compared a recent period (2005–2014) to a 30-year base climatology (1974–2004) and found that the annual number of days with freezing precipitation increased from 0.1 to >3 d over some regions within southern British Columbia.
Transition regions are variable in time and in space. Their occurrence is dependent on many external factors, including changing large-scale atmospheric temperatures and moisture as well as variations in terrain. Their occurrence and features also vary due to internal factors related to, for example, cooling by melting and sublimation that can lead to transition regions moving horizontally (Stewart and McFarquhar, 1987) or down a mountain slope (Thériault et al., 2012; Stoelinga et al., 2012). Accurately simulating the transition region is difficult, especially over orographic regions, where dramatic variations in terrain increase the complexity of the interacting governing processes (Stoelinga et al., 2003; Minder et al., 2011; Ikeda et al., 2013; Marks et al., 2013). The grid-scale resolution and microphysical parameterizations used are important factors to consider when simulating such transition regions (Ikeda et al., 2013). A coarse-resolution model is not able to capture the orographic processes occurring and therefore tends to underestimate precipitation amounts, as shown, for example, in a sensitivity experiment by Ikeda et al. (2010) using high-resolution modelling at different horizontal scales from 2 to 36 km.
An opportunity to begin to address transition regions within the southern Canadian Cordillera did not occur until recently. A major atmospheric field campaign, the Science and Nowcasting of Olympic Weather for Vancouver 2010 (SNOW-V10), was held in conjunction with the 2010 Vancouver Winter Olympic and Paralympic Games. This campaign sought to improve winter weather forecasting within complex terrain, showcasing the difficulty of forecasting for transition precipitation (Thériault et al., 2014; Isaac et al., 2014).
The Coast Mountains, next to the Pacific Ocean, often experience enhanced precipitation due to the interactions between its terrain and the advection of warm moist air (Houze, 2012). During the SNOW-V10 period, the Olympic venues experienced several issues with warm weather, which led to delayed events over Cypress Mountain, whereas Whistler, at a higher elevation, received a great deal of snow but also experienced several transition precipitation occurrences (Goldenberg, 2010; Guttsman, 2010; Thériault et al., 2012, 2014; Isaac et al., 2014; Joe et al., 2014). Thériault et al. (2012) highlighted the dynamical effects of the diabatic cooling from melting, which resulted in the reversal of the valley flow at the base of Whistler Mountain. Thériault et al. (2014) reviewed five storms occurring over Whistler Mountain, including two transition region events. Although temperatures were conducive to melting particles, the often-subsaturated environment led to the sublimation of much of the falling precipitation (Thériault et al., 2014). Another study by Berg et al. (2017) pointed out that precipitation particle trajectories sometimes inhibited precipitation from accumulating at the base of Cypress Mountain from strong advection; the associated vertical air motions were greater than the fall speeds of the precipitation particles.
However, to date no comprehensive region-wide study on the changing transition region over the southern Canadian Cordillera, which includes the Rocky Mountains, has taken place. As global temperatures rise, it is expected that there will be changes to the transition region locations and elevations over this as well as other regions. Moreover, orographic regions are prone to enhanced warming (Mountain Research Initiative EDW Working Group, 2015). It is important to begin to address the transition region future characteristics.
Such regional studies are now feasible because of recent model developments. In particular, the National Center for Atmospheric Research (NCAR) has carried out 4 km resolution simulations using the Weather Research and Forecasting (WRF) model focussed over the contiguous United States but also including southern Canada and northern Mexico (Liu et al., 2016). The correlation was good when model products were evaluated against United States precipitation datasets in the orographic regions of western United States. Given this success, and because our study area is just north of the United States border with similar terrain, we took the opportunity to analyze this unique dataset over Canada. These simulations focussed on a multi-year control period in the recent past (2000–2013) as well as over the same period but under warmer and more moist future conditions using a pseudo-global-warming (PGW) approach. This high-resolution dataset over the contiguous United States (HRCONUS) is discussed in more detail in Sect. 2.
Given the importance of the transition region and its implications on society, the goal of this article is to address this issue of a changing climate. This study's specific objectives are to analyze the transition region during the 2010 SNOW-V10 project using data from the WRF 4 km simulations, with an emphasis on the most severe events, and to examine changes to the transition region under an assumed warmer and more moist climate.
This article is organized as follows. The WRF model set-up and criteria for a transition region are outlined in Sect. 2. The evaluation of the WRF model using observational datasets is presented in Sect. 3. An overview of the transition region under the control and pseudo-global-warming simulations is discussed in Sect. 4. Changes to the transition region are presented in Sect. 5, and societal implications under a PGW approach are presented in Sect. 6. Concluding remarks are given in Sect. 7.
2.1 WRF dataset
The WRF model is a numerical weather-prediction model used for forecasting and research applications (Powers et al., 2017). In recent years, advancements in computing power have allowed for higher-resolution simulations over regional-scale areas.
This WRF simulation conducted by Liu et al. (2016) used 4 km resolution and explicit calculation of convection over the 2000–2013 period. This model was configured using the Thompson aerosol-aware microphysics scheme (Thompson and Eidhammer, 2014) with one-moment prediction of mass mixing ratio for cloud water, snow and graupel and two-moment prediction of the number concentration for cloud ice and rain. This scheme does not include ice pellets. These variables were then used as a basis for calculating the hourly surface snow, graupel and rain as discussed by Thompson and Eidhammer (2014). The determination of surface freezing rain requires a temperature criterion, which is discussed in Sect. 2.2.
The actual simulations were carried out in two steps. First, a control (CTRL) run of the historical conditions using the European Centre for Medium-Range Weather Forecasts Re-Analysis (ERA-Interim) was carried out, followed by, second, a run using a PGW assumption first used by Schär et al. (1996). This PGW method allows one to study the thermodynamic effects of a warmer, more moist climate on historical synoptic systems. In particular, this was accomplished by perturbing the CTRL with the Coupled Model Intercomparison Project 5 (CMIP5; Taylor et al., 2012) ensemble mean high-emission scenario information at the end of the 21st century. This simulation addresses possible changes in storm intensity to historical storms within the latter 21st century (Liu et al., 2016). The PGW scenario varies from traditional climate change scenarios, as it is driven by reanalysis data but perturbed with a climate signal from 19 CMIP5 models. This approach does not consider changes in large-scale forcing, so it can largely be considered to be examining the consequences of changes in thermodynamic forcing. This dataset was utilized in this article because of its high-resolution over complex terrain, availability and ease of access.
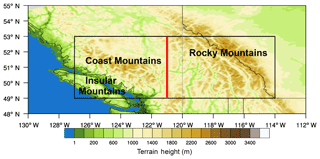
The simulations covered the contiguous United States and included southern Canada and northern Mexico. Given this large dataset and areal coverage, a subset from January–April 2010 was extracted to include the southern Canadian Cordillera from the foothills of the Rocky Mountains to parts of Vancouver Island (−115 to −127∘ W) and from 49 to 53∘ N (Fig. 1). This includes the locations of the SNOW-V10 campaign but also covers many ski destinations in the southern Canadian Cordillera. Moreover, this study area is not adjacent to the boundary of the HRCONUS domain and should therefore not be affected by lateral boundary effects (Liu et al., 2016).
2.2 Transition region definition
Transition regions occurring at the surface are the main focus of this study. These regions are located where mixed precipitation phases occur, including the transition from liquid to solid, such as freezing rain, and where both the solid- and liquid-phase precipitation accumulate at the surface simultaneously. Specifically, within the model, this refers to grid points where there is transition precipitation at the surface on an hourly basis.
It is important to note that 0.2 mm was used as a threshold of each explicit output on an hourly basis. However, Environment and Climate Change Canada (ECCC) considers an accumulation of 0.2 mm to be a trace amount over a 24 h period. Through this higher threshold, this study examines transition regions with greater precipitation accumulation than the minimum ECCC standard and may consequently underestimate the total number of occurrences.
Table 1Transition region categories and their associated precipitation types. Check marks indicate when the ≥0.2 mm criterion was satisfied. A wet-bulb temperature criterion ≤0 ∘C was used to exclude rain, whereas a criterion >0 ∘C was used to exclude freezing rain.
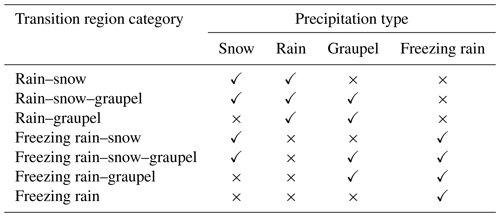
The transition region was broken down into seven categories according to their constituent precipitation (Table 1). These were categorized in a similar manner to the general criteria of transition regions as discussed above, with additional steps to categorize the type of precipitation. To separate the transition types into their respective categories, there were checks used to determine when one precipitation type was missing. For example, under a rain–snow transition category, a criterion to make sure that graupel less than the 0.2 mm threshold was used. The rain–snow–graupel category included all precipitation types ≥0.2 mm, except for freezing rain, which was filtered out using the criterion of wet-bulb 2 m temperatures >0 ∘C. The freezing rain–snow–graupel category was similar, except it used a criterion for wet-bulb 2 m temperatures ≤0 ∘C to exclude rain.
3.1 Temperature and relative humidity
Surface temperature and relative humidity are essential for identifying the transition region and diagnosing the type of precipitation (Matsuo et al., 1981). To evaluate these variables from the CTRL simulation over the January–April 2010 period, ECCC hourly data were retrieved from nine stations (Fig. 2). Table 3 shows average values over this 4-month period. Stations were chosen according to their proximity to ski resorts located at higher elevations and their precipitation observation availability. Of the nine stations, Glacier National Park (NP) Rogers Pass, Yoho NP and Fernie had missing data or did not have hourly data and therefore were not included in the comparison. Temperature and relative humidity were extracted from the closest CTRL grid point to the ECCC station.
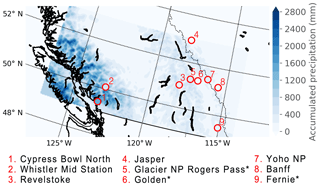
Figure 2Map of CTRL total accumulated precipitation (mm) from January to April 2010 over the study area. Circles indicate the nine ECCC stations used in the precipitation evaluation.
Table 2ECCC observation stations used for CTRL temperature and relative humidity verification for the January–April 2010 period. Stations are listed from west to east. Meteorological data are averaged over the 4-month period at each ECCC station and at the closest CTRL model grid point. RH refers to relative humidity, and the ∗ symbol refers to information only available from 07:00 to 17:00 local time at Golden.
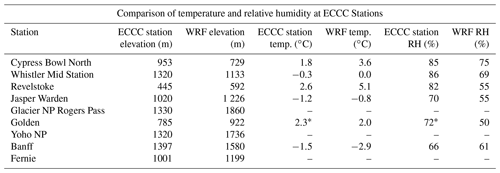
In general, the CTRL was able to simulate the observed temperatures with average values within ±2.5 ∘C at the stations (Table 2). Overall, there is a tendency to overestimate the temperature at Cypress Bowl North, Whistler Mid Station, Revelstoke and Jasper but underestimate the temperature at Banff and Golden. However, temperatures at Golden are only reported during manual observation hours during the day; this explains the higher-than-expected temperatures. Note that 4 km horizontal resolution is still relatively coarse relative to the orographic terrain and in part led to the differences in average temperature between the ECCC stations and the WRF model. For example, the WRF elevation at Banff was 183 m higher than the actual station. Assuming a saturated adiabatic lapse rate, this would translate to an average temperature of −1.8 ∘C, closer to the Banff station temperature average of −1.5 ∘C. In contrast, at Jasper Warden, although the WRF elevation is higher than the station, the average temperature is still higher under the CTRL. There will also be uncertainty in precipitation types as a result of the temperature uncertainties, but this has not been quantified. For example, at four of the six stations where observed and model temperatures were compared, a warm bias was found. It may be that at these locations there would be an accompanying tendency towards liquid forms of precipitation.
The CTRL relative humidities were lower (5 %–27 %) when compared to the ECCC stations. The largest discrepancy was at Revelstoke, particularly at the beginning of the study period from January to mid-March. For transition regions, these subsaturated surface conditions could mean that the model may be underestimating precipitation at the surface due to losses from sublimation or evaporation. This could have an effect on the type of transition precipitation, since the melting process is slowed (Wexler et al., 1954).
3.2 Precipitation
3.2.1 Evaluation using the Canadian Precipitation Analysis
The Canadian Precipitation Analysis (CaPA), a gridded product that uses multiple sources, including radar and observational data and model data that rely on the Global Environmental Multiscale model (GEM), have been used to evaluate real-time precipitation amounts (Lespinas et al., 2015). The CTRL accumulated precipitation from January to April 2010 was re-gridded from 4 km to the coarser 10 km CaPA grid, for grid-to-grid comparison, using a conservative spatial interpolation method. The accumulated precipitation for both the CTRL and CaPA along with their difference is shown in Fig. 3. Overall, the model has a positive bias over the 4-month period of 26 %, with maximum biases over the Coast Mountains (Fig. 3c).
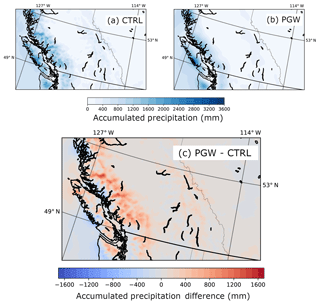
Figure 3(a) Map of CTRL accumulated precipitation (mm) from January to April 2010. Accumulated precipitation is re-gridded onto a coarser 10 km×10 km grid, according to CaPA, using a conservative interpolation. (b) Map of CaPA accumulated precipitation (mm) from January to April 2010. (c) Map of accumulated precipitation difference (CTRL–CaPA; in mm) from January to April 2010.
Spatial correlation of precipitation between the CTRL and CaPA was computed using the Pearson product-moment coefficient of linear regression. There was an overall good agreement in the spatial correlation between the two grids for the 4-month period of 0.839. Moreover, the CTRL precipitation was within observational uncertainty over the Western Cordillera of the United States, extending up to the Canadian border. As this region borders the Canadian Cordillera and the same geography can be extended across the political boundary, we assume that precipitation amounts simulated under the CTRL are likely within observational uncertainty over the southern Canadian Cordillera as well.
The CaPA dataset comes with its own set of issues that leads to an underestimation of solid precipitation amounts, particularly during the cold season with events >5 mm, whereby solid precipitation automatic reports are rejected under routine quality and a heavy reliance on the GEM for precipitation amounts (Lespinas et al., 2015; Wong et al., 2017). However, the GEM only implicitly accounts for orographic effects with a 15 km resolution (Lespinas et al., 2015). This coarse resolution is insufficient in resolving complex terrain effects within the Canadian Cordillera and likely underestimates precipitation. Another consideration is the location of the ECCC sites assimilated into CaPA, mostly located within the valleys (Lespinas et al., 2015); these lead to an unproportional representation of the complex terrain. Moreover, the density of stations used in generating CaPA drops significantly across the US–Canada border as one moves northward.
3.2.2 Evaluation using observational stations
ECCC total monthly precipitation amounts are compared to the nearest WRF model grid point. Adjusted data by Mekis and Vincent (2011) were used where available, and these include Glacier NP Rogers Pass, Golden and Fernie. Mekis and Vincent (2011) adjusted for errors in both rainfall and snowfall measurements. For rainfall measurements, rain-gauge-specific corrections for three of the major gauge types were used within ECCC, and each was adjusted for undercatch from wind, wetting at both the funnel and the receiver or container and evaporation. Snowfall when measured by a ruler was converted to the water equivalent by applying a snow-water-equivalent adjustment factor. This factor was determined by comparing gauge and snow ruler measurements following the techniques described by Metcalfe et al. (1994). The variability in accumulated precipitation is displayed, reporting the range of precipitation accumulations from the eight neighbouring grid points (Figs. 2 and 4).
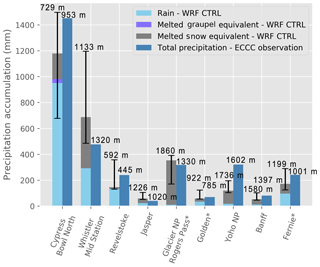
Figure 4Total precipitation accumulation from January to April 2010. The left-hand bars represent the closest CTRL grid point, separated into three components, including rain (including freezing rain), snow and graupel. The vertical bars represent the minimum and maximum total precipitation accumulation of the neighbouring grid points. The right-hand bars display the ECCC unadjusted station observation. Elevations for the model and ECCC station are marked above each respective column; ∗ stations using adjusted precipitation data (Mekis and Vincent, 2011).
Over the nine ECCC stations, the CTRL had a positive bias at Whistler Mid Station, Jasper and Glacier NP Rogers Pass, with values of 10 %–31 %. These stations are located in regions where the CTRL has a positive bias to the CaPA data. The CTRL had a negative bias at Cypress Bowl North, Revelstoke, Golden, Yoho NP, Banff and Fernie by 19 %–168 %, with Yoho NP being the most underestimated station. However, the observed precipitation amounts at the ECCC stations with a positive bias fell within the precipitation range of the neighbouring grid points, except for Yoho NP.
Liu et al. (2016) carried out a 13-year evaluation of the CTRL precipitation snow telemetry sites (SNOTELs) across the Western Cordillera of the United States. They used inverse-distance-weighted average interpolation of the four closest model grid points to the SNOTEL station and found an overall negative bias of −2 %. They also found a Pearson correlation of 0.9 during the cold season (November–April), suggesting that the CTRL was able to realistically simulate orographic precipitation.
Overall, this evaluation of precipitation over the nine ECCC stations is in good agreement with the retrospective CTRL evaluation conducted over the Western Cordillera of the United States using SNOTEL stations (Liu et al., 2016). A low bias was found over the Canadian Rocky Mountains at Revelstoke, Golden, Yoho NP, Fernie and Banff, similar to the findings of Liu et al. (2016) in which a low bias during the cold season over the Colorado Rocky Mountains was found. In contrast, a high bias of 31 % was found over Whistler, which matches the high-bias findings over the Cascade Range (Liu et al., 2016).
Biases found in this study are not unusual, as precipitation gauges are subject to undercatchment and may explain some of the CTRL positive bias to CaPA by 26 %. For example, a recent study by Pan et al. (2016) found that the precipitation gauge underestimated precipitation up to 32.6 % at Marmot Creek, a high-elevation station in the Kananaskis area of Alberta.
Transition regions were very common during the January–April 2010 period. Precipitation occurred on 99 % of the days in both the CTRL and PGW simulations. Of these, 93 % (94 %) had a transition region occurrence under the CTRL (PGW). The actual days with a transition region occurrence in the CTRL and PGW simulations were nearly identical (Figs. 5 and 6). This is expected, as the storm tracks are constrained by spectral nudging that kept synoptic-scale forcings the same (Liu et al., 2016). However, the occurrence, spatial distribution and amount of transition precipitation varied greatly from the CTRL to the PGW and are discussed below.
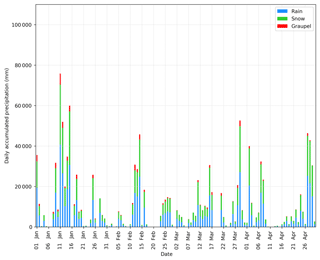
Figure 5Daily accumulated precipitation (mm) within transition regions under CTRL over the January–April 2010 period and organized by rain (blue), snow (green) and graupel (red). Freezing rain occurrence was minimal and was not shown.
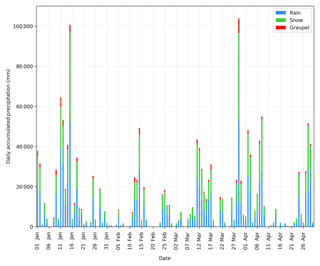
Figure 6Daily accumulated precipitation (mm) within transition regions under PGW over the January–April 2010 period, organized by rain (blue), snow (green) and graupel (red). Freezing rain occurrence was minimal and was not shown.
The total accumulated transition precipitation increased from 1 263 044 mm (CTRL) to 1 606 163 mm (PGW), a 27 % increase, and it accounted for ∼12 % (13 %) of the total precipitation under the CTRL (PGW). On average the hourly transition region occupied an area of 4608 km2 under the CTRL and 5712 km2 under PGW, an increase of 1104 km2. Given the whole domain's area of 407 696 km2, transition regions represented ∼1.1 % (1.4 %) of the spatial area under CTRL (PGW). This transition precipitation mainly occurred over the Insular and Coast Mountains under both the CTRL and PGW. However, under the PGW, less transition precipitation was simulated over the Insular Mountains and more was simulated over the Coast Mountains, especially on its leeward side (Fig. 7).
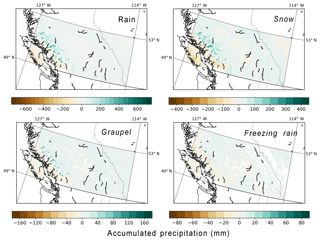
Figure 7Transition region accumulated precipitation difference for snow, graupel, freezing rain and rain (PGW–CTRL) over the January–April 2010 period.
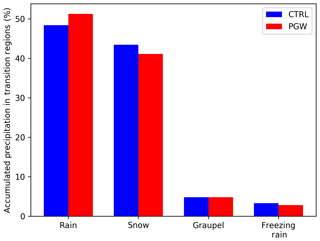
There was a shift in the distribution of accumulated precipitation types within transition regions from CTRL to PGW (Fig. 8). The proportion of snow decreased from 43.5 % (CTRL) to 41.1 % (PGW), corresponding with an increase in rain, from 48.4 % (CTRL) to 51.3 % (PGW). The proportion of graupel remained the same, at 4.8 %. There was a small decrease in the proportion of freezing rain, from 3.3 % (CTRL) to 2.8 % (PGW).
5.1 Transition region categories
Over the 4-month period, all seven transition region categories occurred within the CTRL and PGW simulations and in both the western and eastern sub-areas (Table 3).
Table 3Number of hourly occurrences under each transition region category, along with their differences over both the western and eastern sub-areas, separated at 121∘ W. Occurrences in each category are shown as a proportion in their respective sub-areas and under PGW do not add up to 100 % due to rounding. Average elevations and total sum of occurrences are shown for the western and eastern sub-areas.

Over the western sub-area, the proportions of the transition region categories did not vary greatly from the CTRL to PGW, although every change was significant (α<0.01). For example, rain–snow–graupel increased proportionally from 12.7 % to 14.3 % under PGW; while rain–snow proportionally decreased from 70.1 % to 68.7 %, rain–graupel proportionally decreased from 3.7 % (CTRL) to 2.0 % (PGW), as did the freezing rain–snow category, which decreased from 5.6 % (CTRL) to 4.3 % (PGW). There were no proportional changes to the freezing rain and freezing rain–graupel categories.
Similar statistically significant proportions (α<0.01) occurred over the eastern sub-area, but with fewer transition region occurrences. The rain–snow category also dominated, with a decrease from 84.6 % to 84.0 %. The freezing rain–snow category also decreased from 8.3 % to 5.0 %. The rain–snow–graupel category proportionally increased, from 0.6 % to 3.4 %, and rain–graupel increased proportionally, from 0.2 % to 0.6 %; freezing rain also increased proportionally, from 6.1 % to 6.7 %. The rain–snow–graupel, rain–graupel, freezing rain–snow–graupel and freezing rain–graupel categories each comprised of <1.0 % of the total transition region occurrences.
5.2 Vertical and horizontal movement
Various factors affected the vertical movement of transition regions. First, the widespread increase in temperatures under the PGW simulations naturally led to an upward movement of the transition region.
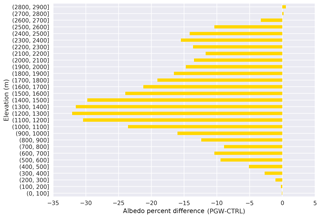
Figure 9Surface albedo percentage difference (PGW–CTRL) within the study area binned at 100 m intervals from 0–3000 m over the January–April 2010 period.
Second, the vertical movement was accentuated by elevation-dependent warming (EDW), whereby higher elevations are more prone to greater warming due to several factors, including the loss in snow cover (Mountain Research Initiative EDW Working Group, 2015). This introduced a non-linear movement that was most apparent over the regions with greatest snow cover loss (900–1500 m) due to the surface albedo change (Fig. 9). This enhanced temperature increase of 4.1 ∘C contributed to the elevation increase over both the eastern and western sub-areas.
Third, PGW precipitation rates increased (Sect. 4). The associated diabatic cooling from the melting and/or evaporation of falling precipitation counters the effects of a rising transition region, and this factor would consequently have lessened the effect of rising temperatures. The precipitation rate is one of the key parameters in determining the vertical movement of the transition region (Stoelinga et al., 2012).
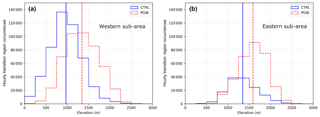
Figure 10Transition region occurrences for the (a) western and (b) eastern sub-areas binned according to elevation. Vertical solid blue lines and dashed red lines represent the average elevation for CTRL and PGW, respectively.
Specifically, transition regions in the western and eastern sub-areas varied in average elevations (Fig. 10). In the western sub-area the average transition region elevation under the CTRL was 971±377 m (mean ± SD) and increased to 1345±397 m under PGW, an increase of 374 m. Over the eastern sub-area, the average elevation for a transition region under the CTRL was 1351±346 and 1591±327 m under the PGW, an increase of 240 m (Fig. 10). The transition region on average was lower, but the increase was greater over the Coast Mountains than over the Rocky Mountains.
There are three explanations for the difference in average elevation. First, the number of grid points with transition precipitation was 3.5 times greater over the western sub-area, often occurring below 1000 m (55 %) and near the sea level under CTRL, whereas the lowest elevation in the eastern sub-area is 333 m (Table 3). Since each sub-area had transition regions up to approximately the same elevation, the average is lower in the west. Secondly and related to this, when warm moist Pacific air entered the study area, the elevation of the 0 ∘C isotherm would at times occur significantly above the peaks of the Insular and Coast Mountains so that only rain fell. The ensuing number of grid points with transition precipitation would be reduced, and the overall average elevation (without these high-elevation ones) would be lower. In contrast, over the Rocky Mountains, the same Pacific air was the dominant cause of transition regions, but the 0 ∘C isotherm still occurred below orographic peaks. Thirdly, the precipitation rate in transition regions was higher over the Insular and Coast Mountains, which, as previously mentioned, would lower its elevation due to diabatic cooling.
The greater increase in average transition region elevation over the western sub-area can also be explained (Fig. 10). Temperature differences at the elevation layer of the average transition region were similar over both sub-areas (approximately 4.1 ∘C), which would imply an expected increase of 600–700 m assuming a saturated adiabatic lapse rate. Actual values were approximately 55 % and 35 % of this over the western and eastern sub-areas, respectively. In the western sub-area, snow did not occur often even in CTRL, so PGW simply meant that transition regions moved upwards except for those near peaks which were eliminated. In the eastern sub-area, snow often occurred in CTRL with no transition regions, so PGW led to their occurrence but at low elevation; existing transitions with CTRL simply moved upwards. For the conditions of these particular simulations, the elimination of high-elevation transition regions over the western sub-area reduced its average elevation increase less than the contribution of additional low-elevation transition regions over the eastern sub-area.
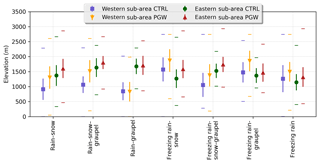
Figure 11Average elevation of transition region categories over the western and eastern sub-areas under both the CTRL (green circles and purple squares) and PGW (red triangles and orange upside-down triangles) and their standard deviations. Minimum and maximum elevations are denoted by horizontal bars.
The transition region categories also displayed variations in elevation (Fig. 11). In CTRL, the average elevations of categories with rain in the western sub-area were approximately 1000 m, and categories with freezing rain were approximately 1300–1500 m in elevation except for freezing rain–snow–graupel, which was lower, close to 1000 m. In contrast, transition regions with rain in the eastern sub-area (at approximately 1500 m) had the highest average elevation. Rain–graupel showed a dramatic difference in average elevation (approximately 830 m) between the western and eastern sub-areas that was also much greater than 1 standard deviation. There were large ranges in actual elevations that were generally highest in the western sub-area, often over 2000 m, whereas in the eastern sub-area the freezing rain-graupel category had a range of only 1000 m. Although the ranges of elevation were large, the standard deviation of all categories was similar (approximately 250–450 m).
All categories over both sub-areas increased in average elevation, with the exception of rain–graupel over the western sub-area, which had a 15 m decrease (Fig. 11). Typical average elevation increases in the western sub-area were at least 300 m, with a maximum of 447 m for the rain–snow–graupel category. Typical increases in the eastern sub-area were less (ranging from 32 to 319 m), except for rain–graupel and freezing rain.
As a consequence of vertical movements associated with higher temperatures, there were horizontal movements as well. As transition regions moved upwards, they also moved eastward from the lower Coast Mountains to the higher Rocky Mountains. This was quantified through a count of hourly transition region categories across the western and eastern sub-areas (Table 3). Under PGW there was a 21 735 (4 %) decrease in the number of hourly transition region occurrences across the western sub-area, in contrast to an increase of 177 282 (125 %) over the eastern sub-area. The fraction in the western sub-area consequently dropped from 77.8 % down to 59.8 %. This horizontal movement is similar to the findings of Klos et al. (2014) whereby transition regions in the western United States are predicted to shift upwards in elevation and consequently eastward, where elevations are higher, but also northward in latitude, where temperatures are colder.
5.3 Extreme events
Extreme events were selected as the days within the top fifth percentile in terms of total transition precipitation accumulation (Table 4). This led to 6 d being classified as extreme, with 3 occurring during a multi-day event on 11–15 January.
Table 4Events within the top fifth percentile over the January–April 2010 period in terms of total transition region precipitation accumulation in the CTRL and PGW simulations.

To characterize the associated synoptic patterns, 6-hourly Japanese 55-year reanalysis (JRA-55) data (Kobayashi et al., 2015) for mean sea-level pressure (MSLP) and integrated water vapour transport (IVT) were analyzed. IVT values were used as a proxy to determine whether atmospheric rivers were present. Specifically, when IVT values >250 kg m−1 s−1 made landfall, an atmospheric river was considered present.
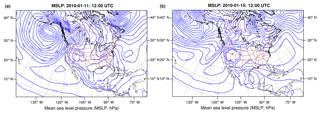
Figure 12Mean sea-level pressure using data from the JRA-55 (Kobayashi et al., 2015) to characterize synoptic patterns. Panel (a) is an example of an Aleutian Low occurring on 11 January 00:00 UTC, and panel (b) is an example of a coastal low occurring on 15 January 12:00 UTC. These atmospheric rivers reached into the eastern sub-area for all of the extreme days, with the exception of 14 February. Under PGW, these five atmospheric rivers extended even farther east and with higher water vapour fluxes.
All the extreme days were characterized by an Aleutian Low or coastal low synoptic pattern and associated with a low level jet and concentrated corridors of water vapour (Fig. 12). These long and relatively narrow corridors have been documented as early as the 1970s within the United Kingdom (Browning and Pardoe, 1973) but were more recently referred to by Zhu and Newell (1998) as atmospheric rivers. In this study atmospheric rivers are characterized by long narrow filaments of water vapour, often preceding the cold front of a storm (Zhu and Newell, 1998). These atmospheric rivers have resulted in extreme precipitation and flooding over the Pacific Northwest, and although they have not been explicitly linked to transition regions, they have been attributed to rain-on-snow events (Guan et al., 2016; Radic et al., 2015). Their role in extreme transition region occurrences is linked to the warmer conditions raising the melting elevation as well as enhancing moisture for precipitation production (Guan et al., 2016).
Previous research has found that atmospheric rivers can extend far inland. There are several trajectories whereby they enter the eastern sub-area, but most occur when first making landfall over the states of Oregon or Washington (Rutz et al., 2015) and were found in each of the present events.
Some atmospheric rivers under PGW led to a decrease in transition precipitation. Decreases of 11 434 and 18 689 mm were found on 11 January and 27 April, respectively. Temperatures on these 2 d were so high over the Insular Mountains that more precipitation fell as liquid only.
6.1 Avalanche implications
The formation of weak layers in the snowpack is essential for its instability and eventual avalanche production (COMET, 2010). Avalanches are complex slope failures and do not always occur naturally but can be triggered by human-related activities. Therefore, this study only examines some of the atmospheric conditions that are conducive to the formation of weak layers.
Avalanches reported within 4 d of the top 5 % of transition region precipitation accumulation days were examined (Table 4). This 4 d criterion is similar to that used by Hatchett et al. (2017), whereby delayed fatalities caused by avalanches were linked to atmospheric rivers. Given the importance of atmospheric rivers to the occurrence of large transition region events, this criterion was used. There were at least 21 avalanche incidents associated with the top 5 % transition region events, with the majority (17) occurring in the eastern sub-area.
Several factors can contribute to avalanches that are also associated with transition regions. These are briefly examined here, with a focus on how they may change in the future. One factor is their mere presence. These regions can lead to weak layers, typically resulting in the release of direct-action avalanches, which were found in a study by Fitzharris (1976) in the Mt. Cook region of New Zealand. The stickiness of the wet snow found within many transition regions can allow it to adhere onto steep surfaces, which are not often avalanche prone because snow sloughs off (Fitzharris, 1976).
A second factor is the increase in the number of transition region occurrences under PGW, which would imply more conducive environments for avalanches in the future. Ski resort statistics across the study area were retrieved from https://www.onthesnow.com/canada/statistics.html (last access: 4 April 2018) to determine where the average transition region elevation would lie with respect to the ski resorts; this includes all the ski resorts within the Alberta and BC ski industry associations found in the study region. Under CTRL the average 4-month transition region occurred within the elevation range of 12 ski resorts, but, under PGW, this average occurred within the elevation range of 16 ski resorts (Fig. 13). Six additional ski resorts were added under PGW, but two were lost because the average 4-month transition region height moved above them (Grouse Mountain and Mt. Seymour). These six additional ski resorts could experience more human-triggered avalanches if no avalanche mitigation efforts are made.
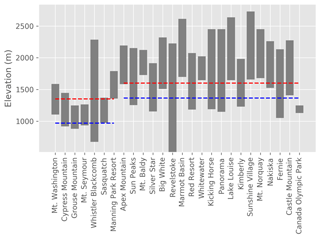
Figure 13Elevation ranges (mean sea level – MSL) from ski resort bases to their mountain summits (retrieved from https://www.onthesnow.com/canada/statistics.html) and average elevations of transition regions under CTRL and PGW simulations. Ski resorts are ordered from west to east. The dashed blue and dashed red lines represent the 4-month average transition region elevations under the CTRL and PGW simulations, respectively, in the west and east sub-areas that are separated at 121∘ W.
A third factor, sometimes, is the presence of heavily rimed particles including graupel. These particles within transition regions are associated with weak layers (Lachapelle, 1967; McClung and Schaerer, 2006). Graupel, which does not adhere well to the surface due to its somewhat spherical nature, acts as a sliding layer within the snowpack for subsequent snowfall (Lachapelle, 1967; COMET, 2010). Accumulated graupel within the transition region under PGW increased by 28 %, which implies increased avalanche risk in the future.
A fourth factor is the order of precipitation occurrence. For example, storms that start with predominantly snow and end with predominantly rain form a weak layer that is both unstable and acts as a sliding layer. An unstable layer is initially formed when heavier density precipitation overlies a layer of lighter-density precipitation (Hägeli and McClung, 2003; McClung and Schaerer, 2006; COMET, 2010; Stimberis and Rubin, 2011).
The order of precipitation occurrence can be related to atmospheric rivers. First of all, a simple conceptual model of the associated precipitation evolution can be envisioned. Prior to the landfalling atmospheric river, temperatures are cool and precipitation would begin as snow, followed by increasing temperatures with the passage of the warm front, resulting in more liquid precipitation. As the cold front sweeps through, temperatures would drop and precipitation would fall as snow. The implication to this precipitation ordering would be the formation of rain crusts on the snowpack, and denser precipitation overtops less dense precipitation, creating a layer of instability. The newly loaded snow associated with the cold front passage is then prone to avalanching.
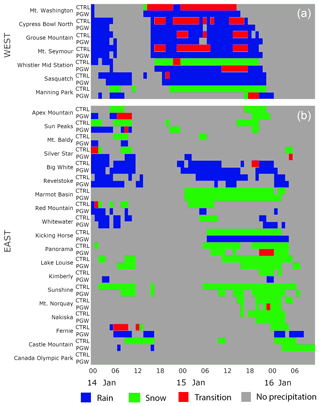
Figure 14Timeline of precipitation type under CTRL and PGW at ski resort base from 14 January 00:00 UTC 2010 to 16 January 12:00 UTC 2010. Precipitation occurrence is shown as rain (blue), green (snow), red (transition region) and grey (no precipitation). Ski resorts are separated from western sub-area (a) to eastern sub-area (b) and are organized from west to east.
This expected temporal evolution was considered beginning on the day preceding the 6 extreme days and ending on the day following (Table 4). This precipitation evolution at ski resorts is shown, for 14–16 January, as an illustrative example in Fig. 14. This precipitation evolution at ski resorts is shown, for 14–16 January, as an illustrative example in Fig. 14. This figure is not an accurate representation of the entire study period (January–April 2010).
This idealized situation is evident at Whistler Mid Station CTRL, on 15 January, when snow began at 17:00 UTC, warmed and turned into a transition for a couple of hours, and then cooled and accumulated as snow. Although the atmospheric river's trajectory extended into the eastern sub-area, the warmest temperatures did not reach 0 ∘C over its associated resorts, so snow mainly occurred.
In general, the precipitation evolution was consistent with expectations over 3 of the 6 d (12 January, 15 January and 14 February) in the western sub-area. In the eastern sub-area, for reasons mentioned above and with ski resorts located at higher elevations, predominantly snow occurred.
Not all extreme days followed the exact precipitation evolution from snow to rain to snow. For example, on 29 March, at the lower elevation ski resorts, the initial conditions were too warm, and only rain fell, hence skipping the first step of the evolution. The rest of the evolution occurred as expected. Furthermore, the orography and the diurnal cycle contributed to the complexity of the evolution. Often, rain would occur in the low-lying valleys, whereas snow would occur at the peak. The precipitation evolution from snow to rain to snow would occur midway along the slope.
Another subtlety was the change between rain and snow without a transition region. A transition region must occur but did not meet the conservative criteria over the hourly timescale (Sect. 2.2). An example occurs on 14 January at 17:00 UTC at Cypress Bowl North, Grouse Mountain and Mt. Seymour, when precipitation switched immediately from all snow to all rain (Fig. 14).
The temperature evolution under PGW remained the same for the 14–16 January extreme event, but with higher temperatures. Therefore, snow that occurred under the CTRL across the western sub-area accumulated as either transition region precipitation or rain, whereas transition region precipitation under the CTRL accumulated as rain under PGW. However, at high-elevation resorts such as Sunshine and Lake Louise, only snow accumulated on both days, since the melting level never rose that high.
6.2 Ski resort implications
Changes in the transition region would impact other sectors of the mountainous region's economy. Ski resorts are major economic drivers, with 8.4 million visitors and USD 790 million in revenue over western Canada in 2015–2016 (Nicolson, 2016). Ski resorts have been resilient to a changing climate, with the use of snow-making machines, but these are energy intensive, costly to run and require specific weather conditions to manufacture; therefore they are not always a viable option.
Precipitation occurring within the transition region implies melting precipitation, which is not ideal for ski resorts and for tourists who prefer light-density snow crystals. With increasing elevations of the transition region, rain will be observed higher up the mountain slopes (Fig. 13). This will raise the snow base and create more crust-like layers, which are undesirable for snow-sport enthusiasts (McClung and Schaerer, 2006). Lower lying ski resorts, often found in the western sub-area, would be the most impacted.
This study focussed on changes to the transition regions over the southern Canadian Cordillera from the Coast to the Rocky Mountains (115–127∘ W and 49–53∘ N) that would be associated with a warmer and more moist climate. The research exploited a number of observational and model datasets over the January–April 2010 period, including the pseudo-global-warming (PGW) dataset (Liu et al., 2016). An evaluation of the control (CTRL) temperature and precipitation found that they compared reasonably well to the limited station observations and CaPA precipitation dataset, and the region of focus is adjacent to well-studied American regions using the same dataset (Liu et al., 2016). This article focussed on the transition region under both the CTRL and PGW simulations and has led to a number of insights as summarized below.
Transition regions were a prominent feature across the southern Canadian Cordillera. They occurred on 93 % (94 %) of the days under the CTRL (PGW). The number of hourly transition occurrences increased greatly with PGW (24 %); their accumulated precipitation accounted for 12 % (13 %) of the total accumulated precipitation over the entire region under CTRL (PGW). A follow-up study should consider a thorough evaluation of the HRCONUS dataset to precipitation type information. There are few manual stations that provide the precipitation phase within the whole study area and throughout the day. However, some specialized automatic stations have recorded precipitation type over short time periods with the use of an optical disdrometer, such as during the 2010 SNOW V-10 experiment (Joe at al., 2014).
Transition regions were broken down into seven categories based on constituent precipitation types. All occurred within both the CTRL and PGW simulations. The rain–snow category was most prevalent under both the CTRL and PGW simulations, and within both sub-areas of the region of focus (separated at 121∘ W), followed by the rain–snow–graupel category, whereas freezing rain was least common. Ice pellets were not considered in this study but can certainly occur within transition regions when an inversion of warm air aloft occurs. A future study may consider using the bulk microphysics scheme developed by Cholette et al. (2019) that explicitly predicts not only ice pellets but also wet snow.
Overall warming contributed to an upward movement of the transition region that varied between the sub-areas and was additionally aided by elevation-dependent warming. Under PGW, the average transition region elevation increased from 971±380 to 1351±380 m for the western sub-area and from 1365±346 to 1600±326 m. These elevations align with the greatest temperature increases that occurred in the 700–1700 m layer, with the loss of snow coverage and subsequent surface albedo reduction (Mountain Research Initiative EDW Working Group, 2015).
There were differences in transition region occurrences between the western and eastern sub-areas. Transition regions over the western sub-area decreased by 4 %, as the melting layer more frequently occurred above the topography, and they increased over the eastern sub-area by 125 %, a consequence of temperatures becoming warm enough to allow transition regions and the higher terrain ensuring that the melting layer was not above it.
The top 5 % of days producing the most transition region precipitation (6 d) displayed similar characteristics. They were all associated with landfalling atmospheric rivers, which brought higher temperatures and more moisture. The expected precipitation evolution of snow, transition precipitation, rain and snow did not always occur, however, due to variations between atmospheric rivers as well as the terrain over which they occurred.
Findings from this study have important implications. Precipitation occurring within the transition region often implies melting precipitation, which is not ideal for skiers who prefer light-density snow crystals. With increasing elevations of the transition region, rain will be observed higher up the mountain slopes (Fig. 13). The increase in transition precipitation, more graupel occurrences and a higher proportion of rain within the transition region would all contribute to the destabilization of the snowpack, increasing the risk of avalanches. Although not considered here, it is expected that the higher water vapour content would lead to more accretion and graupel. The expected increase in the average elevation of the transition region will change the areas at risk for avalanching towards higher terrain. Furthermore, this upward movement will impact ski resorts and their operations, particularly those over the western sub-area, that are lower in terrain.
It is recognized that large-scale dynamic change was not considered and would have major consequences on the movement of storm tracks in scenarios of future conditions. A follow-up study should consider, for example, changing dynamics over a longer time period and a larger study area that includes the entire Canadian Rocky and Coast mountain ranges.
In summary, transition regions were almost always present over the southern Canadian Cordillera over the 4-month illustrative period of January–April 2010. Under a PGW assumption, it is expected that transition regions will increase in hourly occurrence, elevation and precipitation amount, with more freezing rain and graupel, while generally moving eastward. Implications would affect many aspects of society, hydrology and ecology.
The WRF HRCONUS and JRA-55 datasets are available from https://rda.ucar.edu/datasets/ds612.0/ (Rasmussen and Liu, 2017) and https://rda.ucar.edu/datasets/ds628.0/ (Japan Meteorological Agency, 2013; registration required), respectively.
JDA was the lead author for this paper and carried out the scientific analyses. RES wrote part of the paper, assisted with suggestive edits and provided scientific expertise on the analyses.
The authors declare that they have no conflict of interest.
This article is part of the special issue “Understanding and predicting Earth system and hydrological change in cold regions”. It is not associated with a conference.
The authors would like to thank the National Center for Atmospheric Research for providing the WRF dataset that made this article possible and especially Kyoko Ikeda for helping to facilitate data transfer and for her technical expertise. Utmost gratitude is given to Ruping Mo, who provided products using the JRA-55 dataset that were used for synoptic analyses.
This research was supported by the Changing Cold Regions Network, funded by the Natural Sciences and Engineering Research Council of Canada (NSERC) through their Climate Change and Atmospheric Research (CCAR) initiative (grant no. 433923-2012). This research was also supported by Global Water Futures, funded by the Canada First Research Excellence Fund, and by the NSERC Discovery grant of Ronald E. Stewart.
This paper was edited by John Hanesiak and reviewed by two anonymous referees.
Abe, O.: Shear strength and angle of repose of snow layers including graupel, Ann. Glaciol., 38, 305–308, 2004.
Berg, H. S., Stewart, R. E., and Joe, P. I.: The characteristics of precipitation observed over Cypress Mountain during the SNOW-V10 campaign, Atmos. Res., 197, 356–369, https://doi.org/10.1016/j.atmosres.2017.06.009, 2017.
Browning, K. and Pardoe, C.: Structure of low-level jet streams ahead of mid-latitude cold fronts, Q. J. Roy. Meteor. Soc., 99, 619–638, https://doi.org/10.1256/smsqj.42203, 1973.
Canadian Press: B. C. highways paralyzed by winter storm of freezing rain, snow, available at: https://www.huffingtonpost.ca/2017/02/10/bc-highways-closed-coquihalla-storm_n_14677572.html (last access: 4 April 2018), 2017.
Cholette, M., Morrison, H., Milbrandt, J. A., and Thériault, J. M.: Parameterization of the bulk liquid fraction on mixed-phase particles in the Predicted Particle Properties (P3) scheme: Description and Idealized simulations, J. Atmos. Sci., 76, 561–582, https://doi.org/10.1175/JAS-D-18-0278.1, 2019.
COMET: Avalanche weather forecasting, available at: http://www.meted.ucar.edu/afwa/ avalanche/navmenu.php (last access: 4 April 2018), 2010.
Cortinas, J., Bernstein, B., Robbins, C., and Strapp, W.: An analysis of freezing rain, freezing drizzle, and ice pellets across the United States and Canada: 1976–90, Weather Forecast., 19, 377–390, https://doi.org/10.1175/1520-0434(2004)019<0377:aaofrf>2.0.co;2, 2004.
Fitzharris, B.: An avalanche event in the seasonal snow zone of the Mount Cook region, New Zealand, New Zeal. J. Geol. Geop., 19, 449–462, 1976.
Goldenberg, S.: Canada's mild climate leaves winter olympics short of snow, available at: https://www.theguardian.com/sport/2010/feb/10/vancouver-lacks-snow (last access: 4 April 2018), 2010.
Groisman, P. Y., Bulygina, O. N., Yin, X., Vose, R. S., Gulev, S. K., Hanssen-Bauer, I., and Førland, E.: Recent changes in the frequency of freezing precipitation in North America and northern Eurasia, Environ. Res. Lett., 11, 045007, https://doi.org/10.1088/1748-9326/11/4/045007, 2016.
Guan, B., Waliser, D. E., Ralph, F. M., Fetzer, E. J., and Neiman, P. J.: Hydrometeorological characteristics of rain-on-snow events associated with atmospheric rivers, Geophys. Res. Lett., 43, 2964–2973, https://doi.org/10.1002/2016gl067978, 2016.
Guttsman, J.: Olympics-worsening weather threatens more postponements, available at: http://www.reuters.com/article/olympics-weather-idUSN2312070820100223 (last access: 4 April 2018), 2010.
Hägeli, P. and McClung, D. M.: Avalanche characteristics of a transitional snow climate – Columbia Mountains, British Columbia, Canada, Cold Reg. Sci. Technol., 37, 255–276, 2003.
Hatchett, B. J., Burak, S., Rutz, J. J. , Oakley, N. S., Bair, E. H., and Kaplan, M. L.: Avalanche fatalities during atmospheric river events in the western United States, J. Hydrometeorol., 18, 1359–1374, https://doi.org/10.1175/jhm-d-16-0219.1, 2017.
Houze, R.: Orographic effects on precipitating clouds, Rev. Geophys., 50, RG1001, https://doi.org/10.1029/2011rg000365, 2012.
Ikeda, K., Rasmussen, R., Liu, C., Gochis, D., Yates, D., Chen, F., Tewari, M., Barlage, M., Dudhia, J., Miller, K., Arsenault, K., Grubišić, V., Thompson, G., and Guttman, E.: Simulation of seasonal snowfall over Colorado, Atmos. Res., 97, 462–477, 2010.
Ikeda, K., Steiner, M., Pinto, J., and Alexander, C.: Evaluation of cold-season precipitation forecasts generated by the hourly updating High-Resolution Rapid Refresh model, Weather Forecast., 28, 921–939, 2013.
Isaac, G. A., Joe, P. I., Mailhot, J., Bailey, M., Bélair, S., Boudala, F. S., Brugman, M., Campos, E., Carpenter, R. L., Crawford, R. W., Cober, S. G., Denis, B., Doyle, C., Reeves, H. D., Gultepe, I., Haiden, T., Heckman, I., Huang, L. X., Milbrandt, J. A., Mo, R., Rasmussen, R. M., Smith, T., Stewart, R. E., Wang, D., and Wilson, L. J.: Science of Nowcasting Olympic Weather for Vancouver 2010 (SNOW-V10): Science of Nowcasting Olympic Weather for Vancouver 2010 (SNOW-V10): a world weather research programme project, Pure Appl. Geophys., 171, 1–24, https://doi.org/10.1007/s00024-012-0579-0, 2014.
Jamieson, B. and Langevin, P.: Faceting above crusts and associated slab avalanching in the Columbia Mountains, in press for the Proceedings of the 2004 International Snow Science Workshop in Jackson Hole, Wyoming, USA, 19–24 September 2004, American Avalanche Association, 2004.
Jamieson, B., Haegeli, P., and Schweizer, J.: Field observations for estimating the local avalanche danger in the Columbia Mountains of Canada, Cold Reg. Sci. Technol., 58, 84–91, 2009.
Japan Meteorological Agency: JRA-55: Japanese 55-year Reanalysis, Daily 3-Hourly and 6-Hourly Data, updated monthly. Research Data Archive at the National Center for Atmospheric Research, Computational and Information Systems Laboratory, https://doi.org/10.5065/D6HH6H41, 2013.
Joe, P., Scott, B., Doyle, C., Isaac, G., Gultepe, I., Forsyth, D., Cober, S., Campos, E., Heckman, I., Donaldson, N., Hudak, D., Rasmussen, R., Stewart, R. E., Thériault, J. M., Carmichael, H., Bailey, M., and Boudala, F.: The monitoring network of the Vancouver 2010 Olympics, Pure Appl. Geophys., 171, 25–58, 2014.
Klos, Z., Link, T., and Abatzoglou, J.: Extent of the rain–snow transition zone in the western U.S. under historic and projected climate, Geophys. Res. Lett., 41, 4560–4568, https://doi.org/10.1002/2014gl060500, 2014.
Kobayashi, S., Ota, Y., Harada, Y., Ebita, A., Moriya, M., Onoda, H., Onogi, K., Kamahori, H., Kobayashi, C., Endo, H., Miyaoka, K., and Takahashi, K.: The JRA-55 reanalysis: General specifications and basic characteristics, J. Meteorol. Soc. Jpn. Ser. II, 93, 5–48, https://doi.org/10.2151/jmsj.2015-001, 2015.
Lachapelle, E.: The relation of crystal riming to avalanche formation in new snow, Physics of Snow and Ice, 1, 1169–1175, 1967.
Lespinas, F., Fortin, V., Rasmussen, R., and Stadnyk, T.: Performance evaluation of the Canadian Precipitation Analysis (CAPA), J. Hydrometeorol., 16, 2045–2064, https://doi.org/10.1175/jhm-d-14-0191.1, 2015.
Liu, C., Ikeda, K., Rasmussen, R., Barlage, M., Newman, A. J., Prein, A. F., Chen, F., Chen, L., Clark, M., Dai, A., Dudhia, J., Eidhammer, T., Gochis, D., Gutmann, E., Kurkute, S., Li, Y., Thompson, G., and Yates, D.: Continental-scale convection-permitting modeling of the current and future climate of North America, Clim. Dynam., 49, 71–95, https://doi.org/10.1007/s00382-016-3327-9, 2016.
Lundquist, J. D., Neiman, P. J., Martner, B., White, A. B., Gottas, D. J., and Ralph, F. M.: Rain versus snow in the Sierra Nevada, California: Comparing doppler profiling radar and surface observations of melting level, J. Hydrometeorol., 9, 194–211, https://doi.org/10.1175/2007jhm853.1, 2008.
Marks, D., Winstral, A., Reba, M., Pomeroy, J., and Kumar, M.: An evaluation of methods for determining during-storm precipitation phase and the rain/snow transition elevation at the surface in a mountain basin, Adv. Water Resour., 55, 98–110, https://doi.org/10.1016/j.advwatres.2012.11.012, 2013.
Matsuo, T., Sasyo, Y., and Sato, Y.: Relationship between types of precipitation on the ground and surface meteorological elements, J. Meteorol. Soc. Jpn., 59, 462–476, https://doi.org/10.2151/jmsj1965.59.4_462, 1981.
McClung, D. and Schaerer, P.: The Avalanche Handbook. 3rd ed., The Mountaineers Books, Seattle, Washington, USA, 2006.
Mekis, E. and Vincent, L.: An overview of the second generation adjusted daily precipitation dataset for trend analysis in Canada, Atmos. Ocean, 49, 163–177, 2011.
Metcalfe, J. R., Ishida, S., and Goodison, B. E.: A corrected precipitation archive for the Northwest Territories of Canada. In Mackenzie Basin Impact Study, Interim Report# 2 – Proceedings of the sixth biennial AES-DIAND meeting of Northern Climate & Mid Study Workshop of the Mackenzie Basin Impact Study, 10–14 April 1994, Yellowknife, Northwest Territories, Canada, 1994.
Minder, J., Durran, D., and Roe, G.: Mesoscale controls on the mountainside snow line, J. Atmos. Sci., 68, 2107–2127, https://doi.org/10.1175/jas-d-10-05006.1, 2011.
Mountain Research Initiative EDW Working Group: Elevation-dependent warming in mountain regions of the world, Nat. Clim. Change, 5, 424–430, 2015.
Nicolson, C.: Financial impact of the western Canadian ski industry, available at: https://cwsaa.org/financial-impact-of-the-western-canadian-ski-industry/ (last access: 7 July 2019), 2016.
Pan, X., Yang, D., Li, Y., Barr, A., Helgason, W., Hayashi, M., Marsh, P., Pomeroy, J., and Janowicz, R. J.: Bias corrections of precipitation measurements across experimental sites in different ecoclimatic regions of western Canada, The Cryosphere, 10, 2347–2360, https://doi.org/10.5194/tc-10-2347-2016, 2016.
Powers, J. G., Klemp, J. B., Skamarock, W. C., Davis, C. A., Dudhia, J., Gill, D. O., Coen, J. L., Gochis, D. J., Ahmadov, R, Peckham, S. E., Grell, G. A., Michalakes, J., Trahan, S., Benjamin, S. G., Alexander, C. R., Dimego, G. J., Wang, W. ,Schwartz, C. S., Romine G. S., Liu, Z., Snyder, C., Chen, F., Barlage, M. J., Yu, W., and Duda, M. G.: The weather research and forecasting model: Overview, system efforts, and future directions, B. Am. Meteorol. Soc., 98, 1717–1737, 2017.
Radic, V., Cannon, A., Menounos, B., and Gi, N.: Future changes in autumn atmospheric river events in British Columbia, Canada, as projected by CMIP5 global climate models, J. Geophys. Res.-Atmos., 120, 9279–9302, https://doi.org/10.1002/2015jd023279, 2015.
Rasmussen, R. and Liu, C.: High Resolution WRF Simulations of the Current and Future Climate of North America, Research Data Archive at the National Center for Atmospheric Research, Computational and Information Systems Laboratory, https://doi.org/10.5065/D6V40SXP, 2017.
Rutz, J. J., Steenburgh, W. J., and Ralph, F. M.: The inland penetration of atmospheric rivers over western North America: A Lagrangian analysis, Mon. Weather Rev., 143, 1924–1944, 2015.
Schär, C., Frei, C., Lüthi, D., and Davies, H. C.: Surrogate climate-change scenarios for regional climate models, Geophys. Res. Lett., 23, 669–672, 1996.
Stewart, R. E.: Precipitation types in the transition region of winter storms, B. Am. Meteorol. Soc., 73, 287–296, https://doi.org/10.1175/1520-0477(1992)073<0287:ptittr>2.0.co;2, 1992.
Stewart, R. E. and King, P.: Rain–snow boundaries over southern Ontario, Mon. Weather Rev., 115, 1894–1907, https://doi.org/10.1175/1520-0493(1987)115<1894:rboso>2.0.co;2, 1987.
Stewart, R. E. and Mcfarquhar, G. M.: On the width and motion of a rain/snow boundary, Water Resour. Res., 23, 343–350, https://doi.org/10.1029/wr023i002p00343, 1987.
Stewart, R. E., Bachand, D., Dunkley, R., Giles, A., Lawson, B., Legal, L., Miller, S., Murphy, B., Parker, M., Paruk, B., and Yau, M.: Winter storms over Canada, Atmos. Ocean, 33, 223–247, https://doi.org/10.1080/07055900.1995.9649533, 1995.
Stewart, R. E., Thériault, J. M., and Henson, W.: On the characteristics of and processes producing winter precipitation types near 0 ∘C, B. Am. Meteorol. Soc., 96, 623–639, https://doi.org/10.1175/bams-d-14-00032.1, 2015.
Stimberis, J. and Rubin, C.: Glide avalanche response to an extreme rain-on-snow event, Snoqualmie pass, Washington, USA, J. Glaciol., 57, 468–474, https://doi.org/10.3189/002214311796905686, 2011.
Stoelinga, M. T., Hobbs, P. V., Mass, C. F., Locatelli, J. D., Colle, B. A., Houze, R. A., Rangno, A. L., Bond, N. A., Smull, B. F., Rasmussen, R. M., Thompson, G., and Colman, B. R.: Improvement of microphysical parameterization through observational verification experiment, B. Am. Meteorol. Soc., 84, 1807–1826, https://doi.org/10.1175/bams-84-12-1807, 2003.
Stoelinga, M. T., Stewart, R. E., Thompson, G., and Thériault, J.: Microphysical processes within winter orographic cloud and precipitation systems, in: Mountain Weather Research and Forecasting: Recent Progress and Current Challenges, edited by: Chow, F. K., De Wekker, S. F. J., and Snyder, B. J., Springer, Berlin, Germany, 345–408, 2012.
Taylor, K. E., Stouffer, R. J., and Meehl, G. A.: An overview of CMIP5 and the experiment design, B. Am. Meteorol. Soc., 93, 485–498, https://doi.org/10.1175/BAMS-D-11-00094.1, 2012.
Thériault, J. M., Rasmussen, R., Smith, T., Mo, R., Milbrandt, J. A., Brugman, M. M., Joe, P., Isaac, G. A., Mailhot, J., and Denis, B.: A case study of processes impacting precipitation phase and intensity during the Vancouver 2010 Winter Olympics, Weather Forecast., 27, 1301–1325, https://doi.org/10.1175/waf-d-11-00114.1, 2012.
Thériault, J. M., Rasmussen, K. L., Fisico, T., Stewart, R. E., Joe, P., Gultepe, I., Clément, M., and Isaac, G. A.: Weather observations on Whistler Mountain during five storms, Pure Appl. Geophys., 171, 129–155, https://doi.org/10.1007/s00024-012-0590-5, 2014.
Thériault, J. M., Hung, I., Vaquer, P., Stewart, R. E., and Pomeroy, J. W.: Precipitation characteristics and associated weather conditions on the eastern slopes of the Canadian Rockies during March–April 2015, Hydrol. Earth Syst. Sci., 22, 4491–4512, https://doi.org/10.5194/hess-22-4491-2018, 2018.
Thompson, G. and Eidhammer, T.: A study of aerosol impacts on clouds and precipitation development in a large winter cyclone, J. Atmos. Sci., 71, 3636–3658, https://doi.org/10.1175/jas-d-13-0305.1, 2014.
Wexler, R., Reed, R. J., and Honig, J.: Atmospheric cooling by melting snow, B. Am. Meteorol. Soc., 35, 48–51, https://doi.org/10.1175/1520-0477-35.2.48, 1954.
Wong, J. S., Razavi, S., Bonsal, B. R., Wheater, H. S., and Asong, Z. E.: Inter-comparison of daily precipitation products for large-scale hydro-climatic applications over Canada, Hydrol. Earth Syst. Sci., 21, 2163–2185, https://doi.org/10.5194/hess-21-2163-2017, 2017.
Zhu, Y. and Newell, R.: A proposed algorithm for moisture fluxes from atmospheric rivers, Mon. Weather Rev., 126, 725–735, https://doi.org/10.1175/1520-0493(1998)126<0725:apafmf>2.0.co;2, 1998.
- Abstract
- Introduction
- Experimental set-up and methodology
- Evaluation of WRF model
- Occurrence, overall precipitation and locations of transition regions
- Characteristic changes to the transition region under historical and future climates
- Implications for avalanches and ski resorts
- Concluding remarks
- Data availability
- Author contributions
- Competing interests
- Special issue statement
- Acknowledgements
- Financial support
- Review statement
- References


