the Creative Commons Attribution 3.0 License.
the Creative Commons Attribution 3.0 License.
Calibrating electromagnetic induction conductivities with time-domain reflectometry measurements
Giovanna Dragonetti
Alessandro Comegna
Ali Ajeel
Gian Piero Deidda
Nicola Lamaddalena
Giuseppe Rodriguez
Giulio Vignoli
Antonio Coppola
This paper deals with the issue of monitoring the spatial distribution of bulk electrical conductivity, σb, in the soil root zone by using electromagnetic induction (EMI) sensors under different water and salinity conditions. To deduce the actual distribution of depth-specific σb from EMI apparent electrical conductivity (ECa) measurements, we inverted the data by using a regularized 1-D inversion procedure designed to manage nonlinear multiple EMI-depth responses. The inversion technique is based on the coupling of the damped Gauss–Newton method with truncated generalized singular value decomposition (TGSVD). The ill-posedness of the EMI data inversion is addressed by using a sharp stabilizer term in the objective function. This specific stabilizer promotes the reconstruction of blocky targets, thereby contributing to enhance the spatial resolution of the EMI results in the presence of sharp boundaries (otherwise smeared out after the application of more standard Occam-like regularization strategies searching for smooth solutions). Time-domain reflectometry (TDR) data are used as ground-truth data for calibration of the inversion results. An experimental field was divided into four transects 30 m long and 2.8 m wide, cultivated with green bean, and irrigated with water at two different salinity levels and using two different irrigation volumes. Clearly, this induces different salinity and water contents within the soil profiles. For each transect, 26 regularly spaced monitoring soundings (1 m apart) were selected for the collection of (i) Geonics EM-38 and (ii) Tektronix reflectometer data. Despite the original discrepancies in the EMI and TDR data, we found a significant correlation of the means and standard deviations of the two data series; in particular, after a low-pass spatial filtering of the TDR data. Based on these findings, this paper introduces a novel methodology to calibrate EMI-based electrical conductivities via TDR direct measurements. This calibration strategy consists of a linear mapping of the original inversion results into a new conductivity spatial distribution with the coefficients of the transformation uniquely based on the statistics of the two original measurement datasets (EMI and TDR conductivities).
- Article
(6349 KB) - Full-text XML
- BibTeX
- EndNote
Soil water content and salinity vary in space both vertically and horizontally. Their distribution depends on management practices and on the complex nonlinear processes of soil water flow and solute transport, resulting in variable storages of solutes and water (Coppola et al., 2015). Monitoring the actual distribution of water and salts in the soil profile explored by roots is crucial for managing irrigation with saline water, while still maintaining an acceptable crop yield. For water and salt monitoring over large areas, there are now non-invasive techniques based on electromagnetic sensors which allow the bulk electrical conductivity of soils, σb, to be determined (Sheets and Hendrickx, 1995; Corwin and Lesch, 2005; Robinson et al., 2012; Doolittle and Brevik, 2014; Von Hebel et al., 2014, among many others).
σb depends on (i) soil water content θ, (ii) electrical conductivity of the soil solution (salinity) σw, (iii) tortuosity of the soil-pore system τ and (iv) other factors related to the solid phase such as bulk density, clay content and mineralogy.
Electromagnetic induction (EMI) sensors provide measurements of the depth-weighted apparent electrical conductivity (ECa) according to the specific distribution of the bulk electrical conductivity σb, as well as the depth response function of the sensor used (McNeill, 1980). Thus, the dependence on σb makes ECa sensitive to soil salinity and water distributions. In principle, specific procedures for estimating salinity and water content may be developed through controlled laboratory experiments where σb, σw and θ are measured simultaneously (Rhoades and Corwin, 1981). That said, to monitor salinity and water content, it is crucial to correctly infer the depth-distribution of σb from profile-integrated ECa readings. To date, this issue has been tackled by applying two different strategies: the first is to use empirical calibration relations relating the depth-integrated ECa readings to the σb values measured by alternative methods – like Time-domain reflectometry (TDR) – within discrete depth intervals (Rhoades and Corwin, 1981; Lesch et al., 1992; Triantafilis et al., 2000; Amezketa, 2006; Yao and Jingsong, 2010; Coppola et al., 2016). The second consists of the 1-D inversion of the observations from the EMI sensor to reconstruct the vertical conductivity profile (Borchers et al., 1997; Hendrickx et al., 2002; Monteiro Santos et al., 2010; Lavoué et al., 2010; Mester et al., 2011; Minsley et al., 2012; Deidda et al., 2014; Von Hebel et al., 2014).
With regard to ECa inversion, a forward model still commonly used is the cumulative response model or local-sensitivity model (LSM; McNeill, 1980). McNeill's linear approach is well suited to the cases characterized by an induction number B (defined as the ratio between the coil distance and the skin depth) much smaller than 1. However, because of the increasing computing power, improved forward modeling algorithms based on more accurate nonlinear approaches are becoming increasingly common (Hendrickx et al., 2002; Deidda et al., 2003, 2014; Lavoué et al., 2010; Monteiro Santos et al., 2010). For example, these more sophisticated forward modeling codes can cope with a wider range of conductivities for which the assumption B ≪ 1 is not necessarily met.
To obtain reliable vertical distributions of electrical conductivity, the ECa data used for the inversion should consist of multi-configuration data. Hence, data collection should be performed either with the simultaneous use of different sensors or with different acquisition configurations with only one sensor (different configurations may consist of, for example, different coil orientations, varying inter-coil separations and/or frequencies – see, for example, Díaz de Alba and Rodriguez, 2016). Multi-configuration data can be effectively used to invert for vertical electrical conductivity profiling since the ECa measurements actually investigate different, overlapping soil volumes. Devices specifically designed for the simultaneous acquisition of multi-configuration data are currently available. Some of them consist of one transmitter and several receivers with different coil separations and orientations (Monteiro Santos et al., 2010). If, instead, a sensor with a single inter-coil distance and frequency is available, a possible alternative to having multi-configuration measurements could be to record the data at different heights above the ground.
Unfortunately, like every other physical measurement, frequency-domain electromagnetic measurements are sensitive to noise that is very hard to model effectively. Moreover, as discussed, for example, in Lavoué et al. (2010), Mester et al. (2011) and Von Hebel et al. (2014), an instrumental shift in conductivity values could be observed due to system miscalibration and the influence of surrounding conditions such as temperature, solar radiation, power supply conditions, the presence of the operator, zero-leveling procedures, cables close to the system and/or the field setup (see, amongst others, Sudduth et al., 2001; Robinson et al., 2004; Abdu et al., 2007; Gebbers et al., 2009; Nüsch et al., 2010). Hence, the ECa data from EMI measurements would generally require a proper calibration. One option could be to use soil cores as ground-truth data. In this case, ECa measurements at the sampling locations can be compared against ECa data predicted by the theoretical forward response applied to the true electrical conductivity distribution measured directly on the soil cores (Triantafilis et al., 2000; Moghadas et al., 2012). Clearly, this strategy is extremely time- (and resource-) consuming. To avoid drilling, Lavoué et al. (2010) introduced a calibration method, later also adopted by Mester et al. (2011) and Von Hebel et al. (2014), using the electrical conductivity distribution obtained from electrical resistivity tomography (ERT) data as input for electromagnetic forward modeling. The ECa values predicted on the basis of ERT data were used to remove the observed instrumental shift and correct the measured conductivity values by linear regression. However, in general, a prerequisite for such an approach concerns the reliability of the inversion of the ERT result. This is not only due to the quality of the original data but also the adopted inversion procedure. Indeed, ERT inversion is an ill-posed problem: its solutions are characterized by non-uniqueness and instability with respect to the input data (Yu and Dougherty, 2000; Zhdanov, 2002; Günther, 2011). In the Tikhonov regularization framework, ill-posedness is addressed by including the available prior information. Such information can be very general. For example, it can be geometrical (i.e., associated with the presence of smooth or sharp boundaries between different lithologies). Obviously, the final result largely reflects the initial guess formalized via the chosen regularization term (Pagliara and Vignoli, 2006; Günther, 2011; Vignoli et al., 2012; Fiandaca et al., 2015).
When relatively shallow depths have to be explored (1–2 m), direct soil sampling and ERT can be effectively replaced by TDR observations. TDR devices are designed to measure the dielectric properties of soils. More precisely, they measure the apparent electrical permittivity, from which not only the dielectric constant but also the effective electrical conductivity can be deduced (e.g., Dalton et al., 1984; Topp et al., 1988; Weerts et al., 2001; Noborio, 2001; Robinson et al., 2003; Lin et al., 2007, 2008; Thomsen et al., 2007; Huisman et al., 2008; Koestel et al., 2008; Bechtold et al., 2010). In general, TDR measurements might be difficult to use to recover the electrical conductivity with the desired accuracy. However, in the literature, many examples are reported in which, within the range 0.002–0.2 S m−1 (compatible with the examples investigated in the present research) and by properly using the TDR device (e.g., by paying attention to minimize the effects of nonparallel device rods inserted into the ground), the TDR conductivity can be measured with an uncertainty level lower than 5 % (e.g., Huisman et al., 2008; Bechtold et al., 2010). Besides, since the TDR measurements are commonly calibrated in saline solutions just before the field data acquisitions, they could potentially provide a reliable, absolute estimation of the actual ground conductivity (Ferré et al., 1998a). For this reason, in some cases, TDR observations have been proposed as a valid tool for ground-truthing the ERT and, possibly, as an ancillary information source to constraint for the ERT inversions (Koestel et al., 2008). For additional studies dealing with the use of ERT data for the validation of the EMI and TDR measurements for soil characterization, we refer the reader to, for example, Cassiani et al. (2012) and Ursino et al. (2014).
In the present research, we focus on the use of TDR data to absolutely calibrate the conductivities obtained by inverting the EMI measurements. To do this, a dataset collected during an experiment carried out along four transects under different salinity and water content conditions (and monitored with both EMI and TDR sensors) is utilized. We first tackle the problem of inferring the soil electrical conductivity distribution from multi-height ECa readings via the proper inversion strategy. Then we assess the quality of these reconstructions by using TDR data as ground-truth. In this respect, in the following we discuss how to effectively compare the σb values generated by the EMI inversion with the associated TDR values. In fact, as discussed by Coppola et al. (2016), because of their relatively smaller observation volume, TDR data provide quasi-point-like measurements and do not integrate the small-scale variability (in soil water content, solute concentrations, etc.) induced by natural soil heterogeneity. By contrast, EMI data necessarily overrule the small-scale heterogeneities seen by TDR probes as they investigate a much larger volume. Accordingly, the paper provides a methodology to calibrate EMI results by TDR readings. This procedure relies on conditioning the original TDR data and in the statistical characteristics of the two EMI and TDR data series. On the basis of the proposed analysis, we discuss the physical reasons for the differences between EMI and TDR-based bulk electrical conductivity and identify a method to effectively migrate the reliable TDR information across the larger volume investigated by EMI.
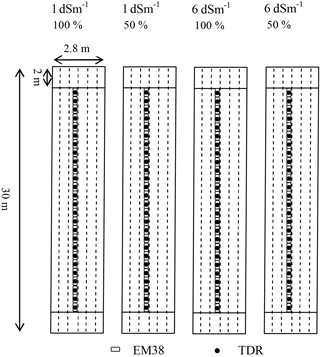
The experiment was carried out at the Mediterranean Agronomic Institute of Bari (MAIB) in south-eastern Italy. The soil was pedologically classified as Colluvic Regosol, consisting of a silty-loam layer of an average depth of 0.6 m on fractured calcarenite bedrock. The experimental setup (Fig. 1) consisted of four transects of 30 m length and 2.8 m width, equipped with a drip irrigation system with five dripper lines placed 0.35 m apart and characterized by an inter-dripper distance of 0.2 m. The dripper discharge was 2 L h−1. Green beans were grown in each transect. The irrigation volumes were calculated according to the time dynamics of water content in the first 0.25 m measured by a TDR probe inserted vertically at the soil surface. TDR readings were taken just before and 2 hours after every irrigation. Based on the difference between the water content at field capacity and that measured just before irrigation, it was easy to assess the volumes needed to bring the soil water content back to the field capacity level.
The four transects were irrigated with water at two different salinity levels and with two different water volumes. Transect 1: 100 % of the irrigation water at 1 dS m−1 (hereafter 100-1dS), Transect 2: 50 % of irrigation water at 1 dS m−1 (50-1dS), Transect 3: 100 % of the irrigation water at 6 dS m−1 (100-6dS) and Transect 4: 50 % of irrigation water at 6 dS m−1 (50-6dS). Water salinity was induced by adding calcium chloride (CaCl2) to tap water. Irrigation volumes were applied every 2 days.
EMI readings – in vertical magnetic dipole configurations – were collected by using a Geonics EM38 device (Geonics Limited, Ontario, Canada). The EM38 operates at a frequency of 14.6 kHz with a coil spacing of 1 m, and with a nominal measurement depth of ∼ 1.5 m (McNeill, 1980). The lateral footprint of the EM38 measurement can be considered approximately equal to the vertical one. Thus, the σb seen by the EMI, in a given depth layer, necessarily differs from that seen by a TDR probe at the same depth layer, due to the very different spatial resolutions.
At the beginning of the measurement campaign, the EMI sensor was “nulled” according to the manufacturer's manual. Readings were taken just after each irrigation application at 1 m step, along the central line of each transect, for an overall total of 26 soundings per transect. Multi-height EM38 readings were acquired at heights of 0.0, 0.2, 0.4 and 0.6 m from the ground. Taking measurements just after irrigation allowed relatively time-stable water contents to be assumed at each site throughout the monitoring phases.
Just after the EM38 measurements, a TDR probe was inserted vertically at the soil surface in 26 locations, each corresponding to the central point of an EM38 reading. A Tektronix 1502C cable tester (Tektronix Inc., Baverton, OR, USA) was used in this study. It enables simultaneous measurement of water content θ and bulk electrical conductivity σb of the soil volume explored by the probe (Heimovaara et al., 1995; Robinson and Friedman, 2003; Coppola et al., 2011, 2015). The TDR transmission line consisted of an antenna cable (RG58, 50 Ω characteristic impedance, 2 m long and with 0.2 Ω connector impedance) and three-wire probes (0.25 m long, 0.07 m inter-axis distance and 0.005 m in diameter). The TDR probe was not embedded permanently at fixed depths along the soil profile to avoid any potential disturbance to the EMI acquisitions. The TDR readings were taken at three different depth intervals (0.0–0.2, 0.2–0.4, 0.4–0.6 m). After the measurements at the surface (0.0–0.2 m), a trench was dug up to 0.2 m depth. TDR probes were then inserted vertically for the additional collection of the data in the interval 0.2–0.4 m, after which the trench was deepened up to 0.4 m and readings were taken at 0.4–0.6 m. The σb,TDR readings were used for the calibration of the EM38 inversion results.
3.1 Multi-height EMI readings inversion
Nonlinear 1-D forward modeling, which predicts multi-height EMI readings from a loop-loop device, can be obtained by suitable simplification of Maxwell's equations that takes the symmetry of the problem into account. This approach is described in detail in Hendrickx et al. (2002), and is based on a classical approach extensively described in the literature (Wait, 1982; Ward and Hohmann, 1988). The predicted data are functions of the electrical conductivity and the magnetic permeability in a horizontally layered medium.
When the coils of the recording device are vertically oriented with respect to the ground surface, the reading at height h can be expressed by using the following integral:
where ρ denotes the distance between the coils, J0(λ) is the Bessel function of the first kind of order 0 and R0(λ) is a complex valued function which depends upon the electromagnetic properties of the ground layers. A similar expression is valid also when the coils are horizontally aligned. Hence, the dependence of the measured data on the electrical conductivity, σk, of the (homogeneous) jth layer is incorporated into the function R0(λ). We discretize the problem with n layers whose characteristic parameters σj (with j = 1, …, n) are the unknowns we invert. In the present research, we neglect any dependence of the electromagnetic response on magnetic permeability as we assume it is fixed and equal to the permeability of empty space. In principle, it is possible to consider two measurements for each location: one for the horizontal and one for the vertical configuration of the transmitting and receiving loops. In this case, the data used as inputs for the inversion are 2 ⋅ m, with m representing the number of heights h1, h2, …, hm where the measurements are performed.
A least squares data fitting approach leads to the minimization of the function:
where σ = (σ1, …, σn)T, and is the misfit between the ith measurement and the corresponding forward modeling prediction based on Eq. (1).
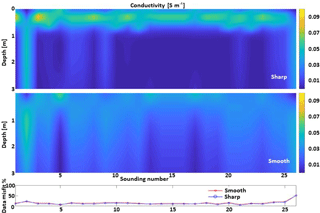
Figure 2Examples of sharp and smooth inversions applied to the dataset 100-6dS. The results are shown together with their corresponding data misfit.
We solve the nonlinear minimization problem by the inversion procedure described in Deidda et al. (2014). The algorithm is based on a damped regularized Gauss–Newton method. The problem is linearized at each iteration by means of a first order Taylor expansion. The use of the exact Jacobian (Deidda et al., 2014) makes the computation faster and more accurate than using a finite difference approximation. The damping parameter is determined in order to ensure both the convergence of the method and the positivity of the solution. The regularized solution to each linear subproblem is computed by the truncated generalized singular value decomposition (TGSVD – Díaz de Alba and Rodriguez, 2016) employing different regularization operators. Besides the classical regularization matrices based on the discretization of the first and second derivatives, in all the cases characterized by sharp interfaces, we tested a nonlinear regularization stabilizer promoting the reconstruction of blocky features and thus to improve the spatial resolution of EMI inversion results. (Zhdanov et al., 2006; Ley-Cooper et al., 2015; Vignoli et al., 2015, 2017). The advantage of this relatively new regularization is that, when appropriate prior knowledge about the medium to reconstruct is available, it can mitigate the smearing and over-smoothing effects of the more standard inversion strategies. This, in turn, can make the calibration of the EMI data against the TDR data more effective. For this reason, in the following, the EMI results used for our assessments are those inferred by means of this sharp inversion. The differences between the “standard” smooth (based on the first derivative) reconstruction and the sharp one are clearly shown in Figs. 2 and 4. In all cases, the inversions are performed with a 100-layer homogeneous discretization, down to 8 m, with fixed interfaces. We opted for such a parameterization to be able to (i) control the inversion results by acting merely on the regularization parameters and (ii) remove the regularization effects possibly originated by the discretization choice (e.g., the number of layers, interfaces locations). In this way, it was possible to use an automatic strategy for the selection of the regularization parameters. In Figs. 2 and 4, the sharp results (upper panels) associated with the cases 100-6dS and 50-6dS are compared against the corresponding smooth inversions (middle panels). Even if the data misfit levels largely match (lower panels in Figs. 2 and 4, but also Figs. 3 and 5), the two inversion strategies produce reconstructions that differ significantly. This is due to the inherent ill-posedness of the EMI inversion. By solely considering the geophysical observations, it is impossible to decide which model is the best. In this research, based on the fact that, just after the irrigation, the effect of the water is supposed to remain localized in the shallowest portion of the soil section, the sharp inversion was found to provide more reliable results. Moreover, to some extent, the general better agreement of the data calculated from the sharp model supports the idea that the electrical property distributions are better inferred via the sharp regularization. In any case, since in this research we calibrate the EMI-derived models (and not the data), the final calibrated result will reflect the assumptions made in the first place, when the EMI data are inverted (specifically, the regularization assumptions).
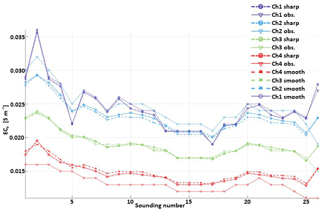
Figure 3Comparison of the data fitting associated with the sharp and smooth inversions applied to the dataset 100-6dS (Fig. 2). The calculated data corresponding to the sharp and smooth results are shown together with the observations for each of the four measured channels (heights).
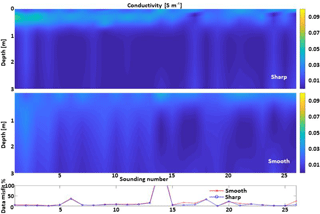
Figure 4Examples of sharp and smooth inversions applied to the dataset 50-6dS. The results are shown together with their corresponding data misfit.
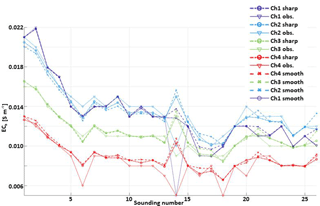
Figure 5Comparison of the data fitting associated with the sharp and smooth inversions applied to the dataset 50-6dS (Fig. 4). The calculated data corresponding to the sharp and smooth results are shown together with the observations for each of the four measured channels (heights).
A possible alternative way to still effectively use the TDR data to calibrate the EMI measurements (and not the associated conductivity model) could consist of performing the calibration in the data space (and not in the model space). In the data-space calibration, the measured TDR conductivity could be used as input model to calculate the ECa response of the EMI device actually used. In turn, this calculated ECa response can be compared against the measured EMI data and used for their calibration. However, eventually, this latter data-space calibration will also have to deal with the inversion issues once the calibrated EMI data need to be converted into conductivities (σb). In this paper, we chose the model-space calibration strategy as, in general, in the available EMI inversion codes, it is not always easy to decouple the forward modeling routines from the overall inversion algorithm. Hence, the discussed approach could be more directly applicable and beneficial for practitioners. However, it is true that the data-space calibration naturally takes into account the scale mismatch between the TDR and the EMI measurements with no need for any statistical calculation.
It is worth noting that the constant magnetic permeability assumption is not always valid. Inverting for the magnetic permeability is sometimes not only necessary but it can also provide an additional tool for soil characterization (e.g., Beard and Nyquist, 1998; Farquharson et al., 2003; Sasaki et al., 2010; Guillemoteau et al., 2016; Noh et al., 2017; Deidda et al., 2017).
For the sake of clarity, hereafter, the σb values generated from the EMI data inversion will be identified explicitly as σb,EMI.
3.2 TDR-based water content and bulk electrical conductivity
The Tektronix 1502C can measure the total resistance Rt of the transmission line by
where Rs is the soil's contribution to total resistance and Rc accounts for the contribution of the series resistance from the cable. The connector Zc is the characteristic impedance of the transmission line and ρ is a reflection coefficient at a very long time, when the waveform has stabilized.
The σb value at 25 ∘C can be calculated as the following (Rhoades and van Schilfgaarde, 1976; Wraith et al., 1993):
where Kc is the geometric constant of the TDR probe and fT is a temperature correction factor to be used for values recorded at temperatures other than 25 ∘C. Both Zc and Kc can be determined by measuring Rt with the TDR probe immersed in a solution with known conductivity σb. Hereafter, these σb measurements will be identified as σb,TDR.
3.3 Evaluation of concordance between σb,TDR measurements and σb,EMI estimates
The agreement between σb,TDR measurements and σb,EMI estimations in the 0.0–0.6 m range was evaluated by the concordance correlation coefficient, ρL.
where mx, my, sx, sy, sxy are means, standard deviations and covariances of the two data series (x = σb,EMI; y = σb,TDR).
Scatter plots of the σb,EMI and σb,TDR data series (both original and filtered) were evaluated by the line of perfect concordance (1 : 1 line) and the reduced major axis of the data (RMA; Freedman et al., 1991). The method combines measurements of both precision and accuracy to determine how close the two data series are to the line of perfect concordance σb,EMI = σb,TDR. Compared to the classical Pearson correlation coefficient, ρP:
ρL not only measures the strength of the linear relationship (how close the data in the scatter plot are to a line) but also the level of agreement (how close that line is to the line of perfect agreement, the 1 : 1 line). In this sense, ρL may also be calculated as (Cox, 2006)
and
where Cb is the bias correction factor measuring how far the best-fit line deviates from the 1 : 1 line. The maximum value of Cb = 1 (0 < Cb < 1) corresponds to no deviation from the line. The smaller Cb is, the greater the deviation from the line. In other words, Cb is a measure of accuracy (how much the average estimate differs from the average measurement value, assumed to be the true value) and refers to the systematic error, whereas ρP is a measure of precision (measures the variability in measurements around their own average) and refers to the random error. The RMA line is given by the following:
This line passes through the means of the x and y values and has a slope given by the sign of Pearson's correlation coefficient, ρP, and the ratio of the standard deviations, s, of the two series (Freedman et al., 1991; Corwin and Lesch, 2005):
ρL increases in value as (i) the RMA approaches the line of perfect concordance (a matter of accuracy) and (ii) the data approach the RMA (a matter of precision). In the ideal case of perfect concordance, the intercept of the RMA, α, should be 0 and β should be 1. Therefore, α ≠ 0 or β ≠ 1 indicate additive and/or multiplicative biases (location and/or scale shifts). The concordance was evaluated for the original TDR data, as well as for the filtered TDR data. For the analysis described in detail later in the paper, it is worth noting that the coefficients α and β depend only on the statistical characteristics (mean and standard deviation) of the two series, as α = my − βmx and β = sy∕sx.
3.4 Fourier filtering
Because of their relatively small observation volume (∼ 10−3 m3), TDR sensors provide quasi-point-like measurements and are, thus, more effective in capturing small-scale variability (in water content, solute concentrations) induced by natural soil heterogeneity. Thus, the variability within a set of TDR readings is expected to originate from a combination of small and large-scale heterogeneities (high and low spatial frequency components). By contrast, the EMI measurements (because of the size and physics of the instrumentation) necessarily integrate out the small-scale variability in the TDR scale of investigation.
Hence, in order to make the two datasets comparable, the original spatial TDR data series need to be filtered to remove the variation from small-scale heterogeneities (recorded only by the TDR probe). In this way, only the information on a spatial scale equal to or larger than the observation volume of both sensors is preserved.
Thus, a simple filter based on the Fourier transform (FT) is applied to the TDR series. So, a low-pass frequency filtering is performed on the TDR data to remove all components related to the small-scale heterogeneities and make it comparable with the EMI measurements. More specifically, for each transect, we consider the σb,EMI reconstruction and, for each of its 1-D models, calculate the average conductivity value within each depth interval for which the TDR data are available (namely 0.0–0.2, 0.2–0.4, 0.4–0.6 m). Hence, for each depth interval, along the entire transect, we can calculate the mean and standard deviation of the conductivity values retrieved from the EMI observations. Subsequently, this standard deviation (associated with the EMI data) is compared with the standard deviation of the iteratively low-pass filtered TDR data for the same depth interval. In this way, an optimal cut-off frequency can be selected to make the scales of the two kinds of measurements compatible. Figure 6 shows the comparison between the standard deviations of the EMI and filtered TDR data, for the 50-6dS transect, at 0.2–0.4 m depth. In this specific case, the selected cut-off frequency to filter the TDR data is 0.313 cycles m−1, corresponding to a 3.2 m range. This is not surprising at this is on the order of magnitude of the footprint of the EMI measurements.
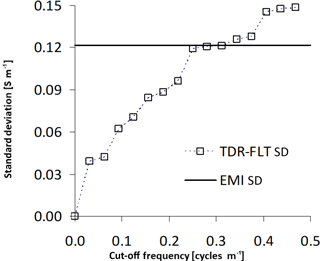
Figure 6Standard deviation of the EMI series (horizontal black line) for the 50-6dS transect at 0.2–0.4 m depth. The squares show the corresponding standard deviations for the TDR series for different levels of filtering. The intersection of the EMI line with the TDR curve allows for identifying the optimal cut-off frequency range (∼ 0.313 cycles m−1) to make the two standard deviations similar.
Hereafter, the original and filtered data will be labeled ORG and FLT, respectively. The graphs in the top panels in Fig. 7 compare σb,TDR measured by TDR against the corresponding conductivity σb,EMI retrieved by the EMI (sharp) inversion for the all the transects. From the left, the graphs refer to the transects identified as 100-6dS, 50-6dS, 100-1dS and 50-1dS, respectively. All plots show the data for the entire investigated profile between 0.0 and 0.6 m, together with the line of perfect concordance (1 : 1, black line), and the main regression axis (MRA, red line).
The general conclusion is that, in all four transects and for all three considered depth layers, the σb,EMI values underestimate the σb,TDR measurements, such that the MRA line generally lies above the 1 : 1 line. Not surprisingly, the EMI result seems quite insensitive to TDR variability. Also, a considerable scatter around the MRA line may be observed for all transects.
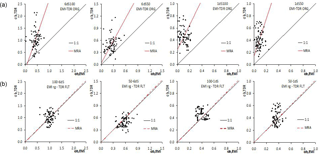
Figure 7Comparison between σb,TDR and σb,EMI for all four transects for the depth range 0.0–0.6 m. The graphs in the top panels (a) show the original TDR and EMI data, while those in the bottom panels (b) the filtered (FLT) TDR and EMI data after the regression based on MRA parameters (rg).
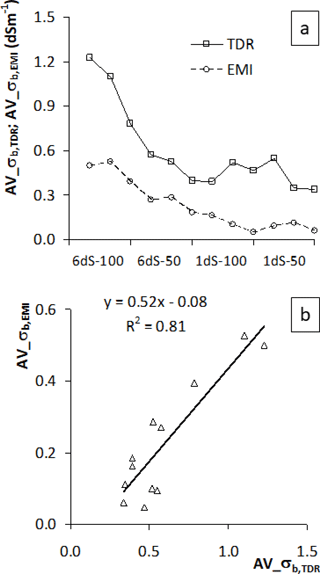
Figure 8(a) Comparison of the means for the two original series (squares and solid line for TDR, circles and dashed line for EMI) and (b) the same comparison on a 1 : 1 plot (triangles and solid regression line). In (a), the four cases are shown in sequence. For each case, the three values are for the three depth intervals 0.0–0.2, 0.2–0.4 and 0.4–0.6 m.
Table 1 shows the MRA coefficients (Cb, α, β), as well as the Pearson, ρP, and the concordance correlation, ρL, for the three depth layers and for all four transects investigated. We recall that the bias correction factor Cb, the slope β and the intercept α should be close to 1, 1 and 0, respectively, for the MRA to approximate the line of perfect concordance. For all the transects and all the depth layers considered, the parameters confirm the relatively loose relationship between σb,EMI and σb,TDR already observed in the graphs, both in terms of accuracy (the distance of the MRA line from the 1 : 1) and precision (the data scatter around the MRA line).
Von Hebel et al. (2014) found a similar behavior when comparing their EMI and ERT datasets. In that case, the ECa values measured by EMI systematically underestimated the ECa generated by applying EMI forward modeling to the σb distribution retrieved by ERT. To remove the bias, the authors performed a linear regression between measured and predicted ECa after applying a 10-term moving average to the original data. By using the regression coefficients, all the measured ECa values were converted to ERT-calibrated ECa values.
Table 1Concordance parameters for the four transects for the TDR_ORG and EMI_ORG data. The table reports the concordance, ρL, and the Pearson, ρP, correlation, as well as parameters α and β of the MRA line. The bias factor, Cb, is also shown.
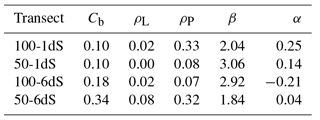
Here, we follow a different approach to calibrate the σb,EMI values against the σb,TDR measurements based on the MRA coefficients and, thus, on the statistical parameters (mean and standard deviation) of the two data series. Specifically, the present approach looks for a systematic correction of the bias based on well-defined statistical sources of the discrepancies. In short, the proposed method performs the calibration in the σb model space, instead of the ECa data space. Our model-space approach mostly relies on the statistical parameters of the two series. Analyzing the role of these statistics in explaining the discrepancies between EMI and TDR data observed in Fig. 7a may help to understand how they can be effectively used for making EMI results directly comparable with the TDR values.
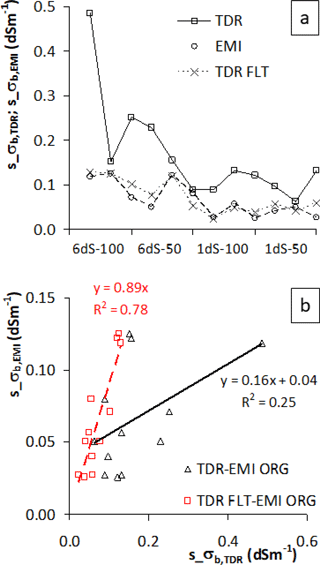
Figure 9(a) Comparison of the standard deviations of the TDR original series (squares and solid line), of the EMI original series (circles and dashed line), and of the filtered (FLT) TDR series (crosses and dashed line) and (b) the same comparison on a 1 : 1 plot: the original TDR and EMI data (triangles and solid regression line); filtered (FLT) TDR and original EMI data (squares and dashed regression line). In (a), the four cases are shown in sequence. For each case, the three values are for the three depth intervals 0.0–0.2, 0.2–0.4 and 0.4–0.6 m.
In nearly all of the graphs in the top panels in Fig. 7, the discrepancies between σb,EMI and σb,TDR values can be decomposed into the following components:
-
The distance along the σb,EMI axis of the MRA line from the 1 : 1 line, which is the difference between the σb,EMI and the σb,TDR means.
-
The difference in the slope of the MRA and of the 1 : 1 lines, which stems from the different variability in σb,EMI (its standard deviation) and that of σb,TDR. We recall here that the slope of the MRA is just the ratio of the two standard deviations, = sy∕sx.
-
The scatter of the data around the MRA line, which may come from different sensors' noise and the influence of surrounding conditions (e.g., temperature).
Below, we analyze in detail the role of all three points with the support of the measured data.
-
The distance of the MRA from the 1 : 1 line is mostly due to the difference in the observed means. The plot in Fig. 8a compares the means for the two original series (squares and solid line for TDR, circles and dashed line for EMI). Figure 8b reports the same comparison on a 1 : 1 plot (triangles and solid regression line). The mean values confirm the general underestimation of TDR by the EMI data. However, the trends are evidently similar, which is reflected in the high correlation between the means of the two series, with a significantly high R2 = 0.81. This high correlation has very positive implications from an applicative point of view, since after the calibration in a specific site, it allows the EMI mean to be inferred given the mean of TDR readings taken in that soil, and thus provides the possibility to migrate the more reliable TDR information across the larger area that can be practically investigated during an EMI survey.
-
The different slope of the two lines has to be ascribed to the different variability in the two series. Figure 9a compares the standard deviations for the two original series (squares and solid line for TDR, circles and dashed line for EMI). Figure 9b reports the same comparison on a 1 : 1 plot (triangles and solid regression line). Conceptually, the different variability in the two series can be related to the different sensor observation volumes (originated from the different spatial sensitivity of the sensors – Coppola et al., 2016). For TDR probes, most of the measurement sensitivity is close to the rods (Ferré et al., 1998b). Conversely, the spatial resolution of inverted EMI ECa values may be much lower as the resolution of the EMI result depends on the physics of the method, the specifications (and configuration) of the recording device and the regularization strategy applied during the inversion. Thus, the EMI is generally unable to capture the small-scale variability seen by the TDR. For our calibration purposes, it is important to make the variability in EMI and TDR conductivities actually comparable. As discussed by Coppola et al. (2016), a possible method can consist of filtering out the high-frequency components (at small spatial scale) of the original TDR data, while retaining the lower-frequency information. This corresponds to keep the information on a spatial scale larger than the observation volume of the TDR sensor and attuned with the resolution of the σb,EMI distribution. From a practical point of view, this makes sense, as TDR readings are often “too local” to actually represent the macroscopic physical characteristics of interest for applications (water content, solute concentrations). The volume explored by a TDR probe may, or may not, include preferential channels (Mallants et al., 1994; Oberdörster et al., 2010), stones (Coppola et al., 2011, 2013), small-scale changes in the texture and structure (Coppola et al., 2011), which can make the interpretation of local measurements difficult for practical applications. In this sense, EMI's removal of these small-scale effects may be desirable from a management perspective. Consistently, the original TDR data are conditioned via a low-pass filtering, as described in Sect. 3. The filtering results, in terms of standard deviations, are reported in Fig. 9a (crosses and dashed line) and Fig. 9b (squares and dashed regression line). As expected, the low-pass filter makes the standard deviations much closer (almost overlapping) in all transects and all considered depth layers. The regression improved significantly from 0.25 for the original data to 0.78 after the TDR data filtering.
-
The scatter is consistently reduced by the spatial filtering (as similarly discussed in Von Hebel et al., 2014).
Eventually, the calibrated distribution (superscript “rg” means EMI data after regression) can then be obtained from the original σb,EMI via the linear mapping
where the coefficients α and β can be easily calculated from the means and standard deviations of the EMI results and the filtered TDR data. Thus, if mEMI and mTDR(FLT), and sEMI, and sTDR(FLT) are the means and the standard deviations of the original σb,EMI EMI data and of the filtered σb,TDR(FLT) TDR data, respectively, the MRA line coefficients can be expressed as α = mTDR(FLT) − βmEMI and β = sTDR(FLT)∕sEMI.
Table 2Concordance parameters for the four transects for the TDR_FLT and EMI_ORG data. The table reports the concordance, ρL, and the Pearson, ρP, correlation, as well as parameters α and β of the MRA line. The bias factor, Cb, is also shown.
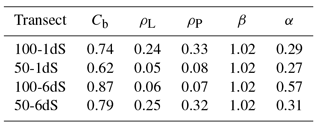
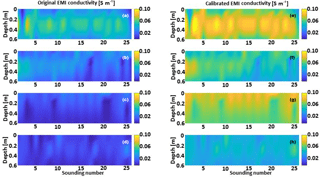
Figure 10Maps of bulk electrical conductivity for the (a) 100-6dS, (b) 50-6dS, (c) 100-1dS and (d) 50-1dS transects showing the original σb,EMI resulting from the inversion of the observed EMI data. (e)–(h) Show instead the corresponding results after the calibration via the TDR measurements (i.e., by applying Eq. 10).
The bottom panels in Fig. 7 show the results of the application of the linear mapping. In particular, they compare the calibrated EMI data (EMI rg) with the filtered TDR (TDR FLT) measurements. The MRA parameters and the concordance coefficients in the case of filtered TDR data are reported in Table 2. Clearly, considering the (calibrated) EMI and (filtered) TDR standard deviations turns the MRA line to be practically matching the 1 : 1 line, with the coefficient β approaching 1. Moreover, from Table 2, the improvement of the bias Cb and the concordance ρL is generally significant. On the contrary, the Pearson's correlation ρP is not influenced by the recalibration as the proposed approach deals with the statistics of the data series rather than the single data. Thus, after the application of the low-pass filter to the TDR data, the coefficient β is close to 1, and the calibration turns out to be (almost) a simple shift of the inverted σb,EMI. The amount of this shift is equal to the difference between the mean values mTDR(FLT) and mEMI. To summarize, the TDR filtering allows removing of the outlier values generated by the small-scale variability and preserving of the information content necessary to properly calculate the shift required for the absolute calibration of the EMI inversion results.
Figure 10 shows, on the left, the original σb,EMI distribution to be compared against the results (on the right) obtained through the application of the linear transformation in Eq. (10). The calibrated transects preserve the spatial variability in the original EMI inversions, but are now characterized by value ranges that are more realistic (as they are obviously closer to the TDR measurements assumed to be more representative of the real soil conditions). The results in Fig. 10 obviously reflect the experimental irrigation setup. Hence, not surprisingly, the conductivity of the 100-6dS case (irrigated with 100 % of the water at 6 dS m−1) is the most effected (Fig. 10d), while the 50-1dS case (corresponding to an irrigation with 50 % of the water at 1 dS m−1) is the example with the lowest conductivity range (Fig. 10g). The intermediate irrigation tests 50-6dS (Fig. 10e) and 100-1dS (Fig. 10f) show very similar maximum and minimum conductivity values over the two transects. However, there is a difference concerning the spatial distributions. In particular, in the 100-1dS case, the highest values characterize not only the shallower 0.0–0.1 m portion (Fig. 10f) but they also appear to spread almost homogenously all over the section. On the contrary, in the 50-6dS test, the maximum values are limited to the first soundings at the beginning of the transect and to the 0.2–0.4 m depth interval. More important, if we compare the original 50-6dS (Fig. 10b) and 100-1dS (Fig. 10c) conductivity distributions against the corresponding calibrated results (Fig. 10e and f), the original σb,EMI section, which used to be the generally most conductive one (50-6dS, Fig. 10b), is now the most resistive (Fig. 10e) and vice versa. This, one more time, demonstrates that the proper calibration may lead to significantly different conclusions.
As already discussed, the high correlation of the means and the standard deviations of the two series are central for this procedure to be of practical interest. In short, the procedure can be summarized as follows: (i) an area is monitored via EMI survey and a few TDR calibration measurements are collected concurrently. (ii) The availability of the two different datasets allows for performing of the regression for the mean and the standard deviation of the original EMI inversion results and the filtered TDR data, like those shown in Figs. 8b and 9b. (iv) These statistical parameters can be promptly used for the calculation of the coefficients α and β to be inserted into Eq. (10). (v) The original EMI inversion results are not always reliable when compared with the direct measurements obtained by using a TDR probe. Rather, they only contain the low-frequency information supplied by TDR (most likely together with some shifts connected with the poor absolute calibration of the EMI system and/or the working conditions, e.g., the temperature). Thus, for quantitative analyses, it may be crucial to transform the original EMI result σb,EMI into a new calibrated section by means of the linear mapping in Eq. (10).
The proposed workflow enables us to translate the original non-calibrated σb,EMI data into the actual σb we would collect in ideal conditions, and which would perfectly match “low-resolution” TDR measurements. is our best possible estimation of the true electrical conductivity on the scale of investigation of the EMI survey. It is the original σb,EMI after the application of the appropriate rescaling and shifts deduced by the more reliable and absolutely calibrated TDR measurements.
The objective of the paper is to infer the bulk electrical conductivity distribution in the root zone from multi-height (potentially non-calibrated) EMI readings. TDR direct measurements are used as ground-truth σb data to evaluate the correctness of the σb estimations generated by EMI inversion. For all four transects and for all three depth layers considered in this study, the σb,EMI values underestimate the σb,TDR measurements, such that the MRA line generally lies above the 1 : 1 line. Also, a considerable scatter around the MRA line was observed for all transects.
The proposed analysis allows for discussing the physical reasons for the differences between EMI- and TDR-based electrical conductivity and developing an approach to calibrate the original σb,EMI by using the σb,TDR measurements.
Our approach is based on the MRA coefficients and, hence, on the statistical parameters (mean and standard deviation) of the two series. Specifically, the approach looks for a systematic correction of the bias based on well-defined statistical sources of the discrepancies. A low-pass filtering has been carried out on the TDR data to obtain a significantly high correlation between the standard deviations of the two data series. After that, a simple linear transformation can be applied to the originally inverted EMI section σb,EMI to get a calibrated σb result.
On the one hand, the proposed strategy relies on the assumption that TDR direct measurements supply absolutely calibrated observations of the electrical conductivity of the soil and can be effectively used to calibrate the conductivity distributions inferred from EMI data. The availability of EMI calibrated data paves the way to reliable reconstructions of the electrical conductivity distribution over large areas (typical for EMI surveys, but not for TDR campaigns) unaffected by the usual EMI miscalibrations. This, in turn, can result in the possibility of effective time-lapse surveys and/or consistent merging of subsequent surveys.
On the other hand, the proposed statistical workflow for making the TDR measurement comparable with the associated EMI results provides a more sophisticated approach than simple smoothing to upscale the TDR data. Thus, from the opposite perspective, the approach in question can be used to tackle the problems connected with handling the TDR data characterized by excessively high spatial resolution.
The dataset used in this paper and the code for data filtering are available on request to antonio.coppola@unibas.it. The code for smooth inversion is available on request at giuseppe.rodriguez@unica.it. The code for sharp inversion is available on request at gpdeidda@unica.it.
The authors declare that they have no conflict of interest.
This work was supported by the Mediterranean Agronomic Institute of Bari (IAMB – Italy)
and by the Doctoral funds of the School of Agricultural, Forestry and Environmental
Sciences (University of Basilicata – Italy). The suggestions and the constructive
comments from Giorgio Cassiani and the anonymous reviewer have significantly
improved the early version of the paper.
Edited by: Erwin Zehe
Reviewed by: Giorgio Cassiani and one anonymous referee
Abdu, H., Robinson, D. A., and Jones, S. B.: Comparing bulk soil electrical conductivity determination using the DUALEM-1S and EM38-DD electromagnetic induction instruments, Soil Sci. Soc. Am. J., 71, 189–196, https://doi.org/10.2136/sssaj2005.0394, 2007.
Amezketa, E.: An integrated methodology for assessing soil salinization, a pre-condition for land desertification, J. Arid Environ., 67, 594–606, https://doi.org/10.1016/j.jaridenv.2006.03.010, 2006.
Beard, L. P. and Nyquist, J. E.: Simultaneous inversion of airborne electromagnetic data for resistivity and magnetic permeability, Geophysics, 63, 1556–1564, 1998.
Bechtold, M., Huisman, J. A., Weihermüller, L., and Vereecken, H.: Accurate determination of the bulk electrical conductivity with the TDR100 cable tester, Soil Sci. Soc. Am. J., 74, 495–501, 2010.
Borchers, B., Uram, T., and Hendrickx, J. M. H.: Tikhonov regularization of electrical conductivity depth profiles in field soils, Soil Sci. Soc. Am. J., 61, 1004–1009, https://doi.org/10.2136/sssaj1997.03615995006100040002x, 1997.
Cassiani, G., Ursino, N., Deiana, R., Vignoli, G., Boaga, J., Rossi, M., Perri, M. T., Blaschek, M., Duttmann, R., Meyer, S., Ludwig, R., Saddu, A., Dietrich, P., and Werban, U.: Noninvasive Monitoring of Soil Static Characteristics and Dynamic States: A Case Study Highlighting Vegetation Effects on Agricultural Land, Vadose Zone J., 11, vzj2011.0195, https://doi.org/10.2136/vzj2011.0195, 2012.
Coppola, A., Comegna, A., Dragonetti, G., Dyck, M., Basile, A., Lamaddalena, N., Kassab, M., and Comegna, V.: Solute transport scales in an unsaturated stony soil, Adv. Water Resour., 34, 747–759, https://doi.org/10.1016/j.advwatres.2011.03.006, 2011.
Coppola, A., Dragonetti, G., Comegna, A., Lamaddalena, N., Caushi, B., Haikal, M. A., and Basile, A.: Measuring and modeling water content in stony soils, Soil Till. Res., 128, 9–22, 2013.
Coppola, A., Chaali, N., Dragonetti, G., Lamaddalena, N., and Comegna, A.: Root uptake under non-uniform root-zone salinity, Ecohydrology, 8, 1363–1379, https://doi.org/10.1002/eco.1594, 2015.
Coppola, A., Smettem, K., Ajeel, A., Saeed, A., Dragonetti, G., Comegna, A., Lamaddalena, N., and Vacca, A.: Calibration of an electromagnetic induction sensor with time-domain reflectometry data to monitor rootzone electrical conductivity under saline water irrigation, Eur. J. Soil Sci., 67, 737–748, https://doi.org/10.1111/ejss.12390, 2016.
Corwin, D. L. and Lesch, S. M.: Apparent soil electrical conductivity measurements in agriculture, Comput. Electron. Agr., 46, 11–43, 2005.
Cox, N. J.: Assessing agreement of measurements and predictions in geomorphology, Geomorphology, 76, 332–346, 2006.
Dalton, F. N., Herkelrath, W. N., Rawlins, D. S., and Rhoades, J. D.: Time domain reflectometry: Simultaneous measurement of soil water content and electrical conductivity with a single probe, Science, 224, 989–990, 1984.
Deidda, G. P., Bonomi, E., and Manzi, C.: Inversion of electrical conductivity data with Tikhonov regularization approach: some considerations, Ann. Geophys., 46, 549–558, 2003.
Deidda, G. P., Fenu, C., and Rodriguez, G.: Regularized solution of a nonlinear problem in electromagnetic sounding, Inverse Probl., 30, 125014, https://doi.org/10.1088/0266-5611/30/12/125014, 2014.
Deidda, G. P., Diaz De Alba, P., and Rodriguez, G.: Identifying the magnetic permeability in multi-frequency EM data inversion, Elect. T. Numer. Anal., 47, 1–17, 2017.
Díaz de Alba, P. and Rodriguez, G.: Regularized Inversion of Multi-Frequency EM Data in Geophysical Applications, in: Trends in Differential Equations and Applications, SEMA SIMAI Springer Series, vol. 8, edited by: Ortegón Gallego, F., Redondo Neble, M., and Rodríguez Galván, J., Springer, Cham, https://doi.org/10.1007/978-3-319-32013-7_20, 2016.
Doolittle, J. A. and Brevik, E. C.: The use of electromagnetic induction techniques in soils studies, Geoderma, 223, 33–45, 2014.
Farquharson, C. G., Oldenburg, D. W., and Routh, P. S.: Simultaneous 1D inversion of loop-loop electromagnetic data for both magnetic susceptibility and electrical conductivity, Geophysics, 68, 1857–1869, 2003.
Ferré, P. A., Redman, J. D., Rudolph, D. L., and Kachanoski, R. G.: The dependence of the electrical conductivity measured by time domain refiectometry on the water content of a sand, Water Resour. Res., 34, 1207–1213, 1998a.
Ferré, P. A., Knight, J. H., Rudolph, D. L., and Kachanoski, R. G.: The sample areas of conventional and alternative time domain reflectometry probes, Water Resour. Res., 34, 2971–2979, 1998b.
Fiandaca, G., Doetsch, J., Vignoli, G., and Auken, E.: Generalized focusing of time-lapse changes with applications to direct current and time-domain induced polarization inversions, Geophys. J. Int., 203, 1101–1112, https://doi.org/10.1093/gji/ggv350, 2015.
Freedman, D., Pisani, R., Purves, R., and Adhikari, A.: Statistics, 2nd Edn., W. W. Norton, New York, 1991.
Gebbers, R., Lück, E., Dabas, M., and Domsch, H.: Comparison of instruments for geoelectrical soil mapping at the field scale, Near Surf. Geophys., 7, 179–190, https://doi.org/10.3997/1873-0604.2009011, 2009.
Guillemoteau, J., Simon, F. X., Luck, E., and Tronicke, J.: 1D sequential inversion of portable multi-configuration electromagnetic induction data, Near Surf. Geophys., 14, 411–420, 2016.
Günther, T.: Timelapse ERT inversion approaches and their applications, Geoelect. Monitor., 91, 91–97, 2011.
Heimovaara, T. J., Focke, A. G., Bouten, W., and Verstraten, J. M.: Assessing temporal variations in soil water composition with time domain reflectometry, Soil Sci. Soc. Am. J., 59, 689–698, https://doi.org/10.2136/sssaj1995.03615995005900030009x, 1995.
Hendrickx, J. M. H., Borchers, B., Corwin, D. L., Lesch, S. M., Hilgendorf, A. C., and Schlue, J.: Inversion of soil conductivity profiles from electromagnetic induction measurements, Soil Sci. Soc. Am. J., 66, 673–685, https://doi.org/10.2136/sssaj2002.6730, 2002.
Huisman, J. A., Lin, C. P., Weihermüller, L., and Vereecken, H.: Accuracy of Bulk Electrical Conductivity Measurements with Time Domain Reflectometry, Vadose Zone J., 7, 426–433, 2008.
Koestel, J., Kemna, A., Javaux, M., Binley, A., and Vereecken, H.: Quantitative imaging of solute transport in an unsaturated and undisturbed soil monolith with 3-D ERT and TDR, Water Resour. Res., 44, W12411, https://doi.org/10.1029/2007WR006755, 2008.
Lavoué, F., van der Kruk, J., Rings, J., André, F., Moghadas, D., Huisman, J. A., Lambot, S., Weihermüller, L., Vanderborght, J., and Vereecken, H..: Electromagnetic induction calibration using apparent electrical conductivity modelling based on electrical resistivity tomography, Near Surf. Geophys., 8, 553–561, 2010.
Lesch, S. M., Rhoades, J. D., Lund, L. J., and Corwin, D. L.: Mapping soil salinity using calibrated electromagnetic measurements, Soil Sci. Soc. Am. J., 56, 540–548, https://doi.org/10.2136/sssaj1992.03615995005600020031x, 1992.
Ley-Cooper, A. Y., Viezzoli, A., Guillemoteau, J., Vignoli, G., Macnae, J., Cox, L., and Munday, T.: Airborne electromagnetic modelling options and their consequences in target definition, Explor. Geophys., 46, 74–84, https://doi.org/10.1071/eg14045, 2015.
Lin, C. P., Chung, C. C., and Tang, S. H.: Accurate time domain reflectometry measurement of electrical conductivity accounting for cable resistance and recording time, Soil Sci. Soc. Am. J., 71, 1278–1287, 2007.
Lin, C. P., Chung, C. C., Huisman, J. A., and Tang, S. H.: Clarification and calibration of reflection coefficient for time domain reflectometry electrical conductivity measurement, Soil Sci. Soc. Am. J., 72, 1033–1040, 2008.
Mallants, D., Vanclooster, M., Meddahi, M., and Feyen, J.: Estimating solute transport in undisturbed soil columns using time-domain reflectometry, J. Contam. Hydrol., 17, 91–109, https://doi.org/10.1016/0169-7722(94)90016-7, 1994.
McNeill, J. D.: Electromagnetic terrain conductivity measurement at low induction numbers, Geonics Limited Ontario, Canada, 1980.
Mester, A., Van Der Kruk, J., Zimmermann, E., and Vereecken, H.: Quantitative Two-Layer Conductivity Inversion of Multi-Configuration Electromagnetic Induction Measurements, Vadose Zone J., 10, 1319–1330, https://doi.org/10.2136/vzj2011.0035, 2011.
Minsley, B. J., Smith, B. D., Hammack, R., Sams, J. I., and Veloski, G.: Calibration and filtering strategies for frequency domain electromagnetic data, J. Appl. Geophys., 80, 56–66, https://doi.org/10.1016/j.jappgeo.2012.01.008, 2012.
Moghadas, D., André, F., Bradford, J. H., van der Kruk, J., Vereecken, H., and Lambot, S.: Electromagnetic induction antenna modelling using a linear system of complex antenna transfer functions, Near Surf. Geophys., 10, 237–247, https://doi.org/10.3997/1873-0604.2012002, 2012.
Monteiro Santos, F. A., Triantafilis, J., Bruzgulis, K. E., and Roe, J. A. E.: Inversion of Multiconfiguration Electromagnetic (DUALEM-421) Profiling Data Using a One-Dimensional Laterally Constrained Algorithm, Vadose Zone J., 9, 117–125, https://doi.org/10.2136/vzj2009.0088, 2010.
Noborio, K.: Measurement of soil water content and electrical conductivity by time domain reflectometry: A review, Comput. Electron. Agr., 31, 213–237, 2001.
Noh, K., Lee, K. H., Oh, S., Seol, S. J., and Byun, J.: Numerical evaluation of active source magnetics as a method for imaging high-resolution near-surface magnetic heterogeneity, Geophysics, 82, J27–J38, 2017.
Nüsch, A. K., Dietrich, P., Werban, U., Behrens, T., and Prakongkep, N.: Acquisition and reliability of geophysical data in soil science, Paper read at 19th world congress of soil science, soil solutions for a changing world, Brisbane, Australia, 2010.
Oberdörster, C., Vanderborght, J., Kemna, A., and Vereecken, H.: Investigating preferential flow processes in a forest soil using time domain reflectometry and electrical resistivity tomography, Vadose Zone J., 9, 350–361, 2010.
Pagliara, G. and Vignoli, G.: Focusing inversion techniques applied to electrical resistance tomography in an experimental tank, in: XI International Congress of the International Association for Mathematical Geology, Liège, Belgium, 2006.
Rhoades, J. D. and Corwin, D. L.: Determining soil electrical conductivity–depth relations using an inductive electromagnetic soil conductivity meter, Soil Sci. Soc. Am. J., 45, 255–260, 1981.
Rhoades, J. D. and van Schilfgaarde, J.: An electrical conductivity probe for determining soil salinity, Soil Sci. Soc. Am. J., 40, 647–651, https://doi.org/10.2136/sssaj1976.03615995004000050016x, 1976.
Robinson, D. A. and Friedman, S. P.: A method for measuring the solid particle permittivity or electrical conductivity of rocks, sediments, and granular materials, J. Geophys. Res.-Sol. Ea., 108, 2076, https://doi.org/10.1029/2001JB000691, 2003.
Robinson, D. A., Jones, S. B., Wraith, J. M., Or, D., and Friedman, S. P.: A review of advances in dielectric and electrical conductivity measurement using time domain reflectometry, Vadose Zone J., 2, 444–475, 2003.
Robinson, D. A., Lebron, I., Lesch, S. M., and Shouse, P.: Minimizing Drift in Electrical Conductivity Measurements in High Temperature Environments using the EM-38, Soil Sci. Soc. Am. J., 68, 339–345, https://doi.org/10.2136/sssaj2004.3390, 2004.
Robinson, D. A., Abdu, H., Lebron, I., and Jones, S. B.: Imaging of hill-slope soil moisture wetting patterns in a semi-arid oak savanna catchment using time-lapse electromagnetic induction, J. Hydrol., 416–417, 39–49, https://doi.org/10.1016/j.jhydrol.2011.11.034, 2012.
Sasaki, Y., Kim, J., and Cho, S.: Multidimensional inversion of loop-loop frequency domain EM data for resistivity and magnetic susceptibility, Geophysics, 75, 213–223, 2010.
Sheets, K. R. and Hendrickx, J. M. H.: Noninvasive soil water content measurement using electromagnetic induction, Water Resour. Res., 31, 2401–2409, 1995.
Sudduth, K. A., Drummond, S. T., and Kitchen, N. R.: Accuracy issues in electromagnetic induction sensing of soil electrical conductivity for precision agriculture, Comput. Electron. Agr., 31, 239–264, https://doi.org/10.1016/S0168-1699(00)00185-X, 2001.
Thomsen, A., Schelde, K., Drøscher, P., and Steffensen, F.: Mobile TDR for geo-referenced measurement of soil water content and electrical conductivity, Precis. Agricult., 8, 213–223, 2007.
Topp, G. C., Yanuka, M., Zebchuk, W. D., and Zegelin, S.: Determination of electrical conductivity using time domain Reflectometry: Soil and water experiments in coaxial lines, Water Resour. Res., 24, 945–952, 1988.
Triantafilis, J., Laslett, G. M., and McBratney, A. B.: Calibrating an electromagnetic induction instrument to measure salinity in soil under irrigated cotton, Soil Sci. Soc. Am. J., 64, 1009–1017, https://doi.org/10.2136/sssaj2000.6431009x, 2000.
Ursino, N., Cassiani, G., Deiana, R., Vignoli, G., and Boaga, J.: Measuring and modeling water-related soil–vegetation feedbacks in a fallow plot, Hydrol. Earth Syst. Sci., 18, 1105–1118, https://doi.org/10.5194/hess-18-1105-2014, 2014.
Vignoli, G., Deiana, R., and Cassiani, G.: Focused inversion of vertical radar profile (VRP) traveltime data, Geophysics, 77, H9–H18, https://doi.org/10.1190/geo2011-0147.1, 2012.
Vignoli, G., Fiandaca, G., Christiansen, A. V., Kirkegaard, C., and Auken, E.: Sharp spatially constrained inversion with applications to transient electromagnetic data, Geophys. Prospect., 63, 243–255, 2015.
Vignoli, G., Sapia, V., Menghini, A., and Viezzoli, A.: Examples of Improved Inversion of Different Airborne Electromagnetic Datasets Via Sharp Regularization, J. Environ. Eng. Geophys., 22, 51–61, https://doi.org/10.2113/jeeg22.1.51, 2017.
Von Hebel, C., Rudolph, S., Mester, A., Huisman, J. A., Kumbhar, P., Vereecken, H., and van der Kruk, J.: Three-dimensional imaging of subsurface structural patterns using quantitative large-scale multiconfiguration electromagnetic induction data, Water Resour. Res., 50, 2732–2748, 2014.
Wait, J. R.: Geo-Electromagnetism, in: Geo-Electromagnetism, Academic Press, New York, USA, 1–67, 1982.
Ward, S. H. and Hohmann, G. W.: Electromagnetic theory for geophysical applications, in: Electromagnetic methods in applied geophysics, Society of Exploration Geophysicists, Tulsa, OK, https://doi.org/10.1190/1.9781560802631, 1988.
Weerts, A. H., Huisman, J. A., and Bouten, W.: Information content of time domain reflectometry waveforms, Water Resour. Res., 37, 1291–1299, 2001.
Wraith, J. M., Woodbury, B. L., Inskeep, W. P., and Comfort, S. D.: A simplified waveform analysis approach for monitoring solute transport using time-domain reflectometry, Soil Sci. Soc. Am. J., 57, 637–642, 1993.
Yao, R. and Jingsong, Y.: Quantitative evaluation of soil salinity and its spatial distribution using electromagnetic induction method, Agr. Water Manage., 97, 1961–1970, https://doi.org/10.1016/j.agwat.2010.02.001, 2010.
Yu, M. and Dougherty, D. E.: Modified total variation methods for three-dimensional electrical resistance tomography inverse problems, Water Resour. Res., 36, 1653–1664, 2000.
Zhdanov, M. S.: Geophysical Inverse Theory and Regularization Problems, in: Methods in Geochemistry and Geophysics, Elsevier, Amsterdam, New York, Tokyo, 2002.
Zhdanov, M. S., Vignoli, G., and Ueda, T.: Sharp boundary inversion in crosswell travel-time tomography, J. Geophys. Eng., 3, 122–134, 2006.


